
Layton Wellbeing Survey Findings 2022
By Dr. Courtney Flint and Team
courtney.flint@usu.edu
435-797-8635
Summary
Layton City is one of 33 cities participating in the Utah Wellbeing Survey Project in 2022. This project is designed to assess the wellbeing and local perspectives of city residents and to provide information to city leaders to inform their general planning process.
We are grateful to all participants who took the survey and to our city partners who helped to make this possible. Additionally, we are grateful to the Utah League of Cities and Towns and USU Extension for their financial support.
What is in this report?
This report describes findings from the 2022 Layton survey and some comparative information with other project cities. Feedback from city leaders, planners, and residents is welcome.
How was the survey conducted?
Starting in March of 2022, Layton City advertised the survey via social media and utility bills. All city residents age 18+ were encouraged to take the online Qualtrics survey.
How many people responded?
- 319 viable surveys were recorded in this 2022 survey effort with 90.9% complete responses.
- The 2021 Layton survey had 403 responses. Past reports are available on the Utah Wellbeing Project website.
- The adult population of Layton was estimated at 53,537, based on the 2016-2020 American Community Survey by the U.S. Census. The 319 survey responses in 2022 represent 0.6% of the adult population and have a conservative margin of error of 5.47%.
Key Findings
Overall Personal Wellbeing and Community Wellbeing in Layton were above average among the 33 study cities. Overall Personal Wellbeing increased in Layton between 2021 and 2022 and Community Wellbeing remained nearly the same between the two study years. Wellbeing, domain ratings, and domain importance varied within Layton by demographic characteristics (with religion, age, and income being particularly important factors across multiple variables).
Highest Rated Wellbeing Domains:
- Safety and Security
- Living Standards
- Mental Health
- Education
Most Important Wellbeing Domains:
- Mental Health
- Safety and Security
- Physical Health
- Living Standards
Red Zone Domain: (High Importance, Lower Quality)
- Local Environmental Quality
Perceptions that residents take action and feelings of community connection were lower in Layton than in many other study communities.
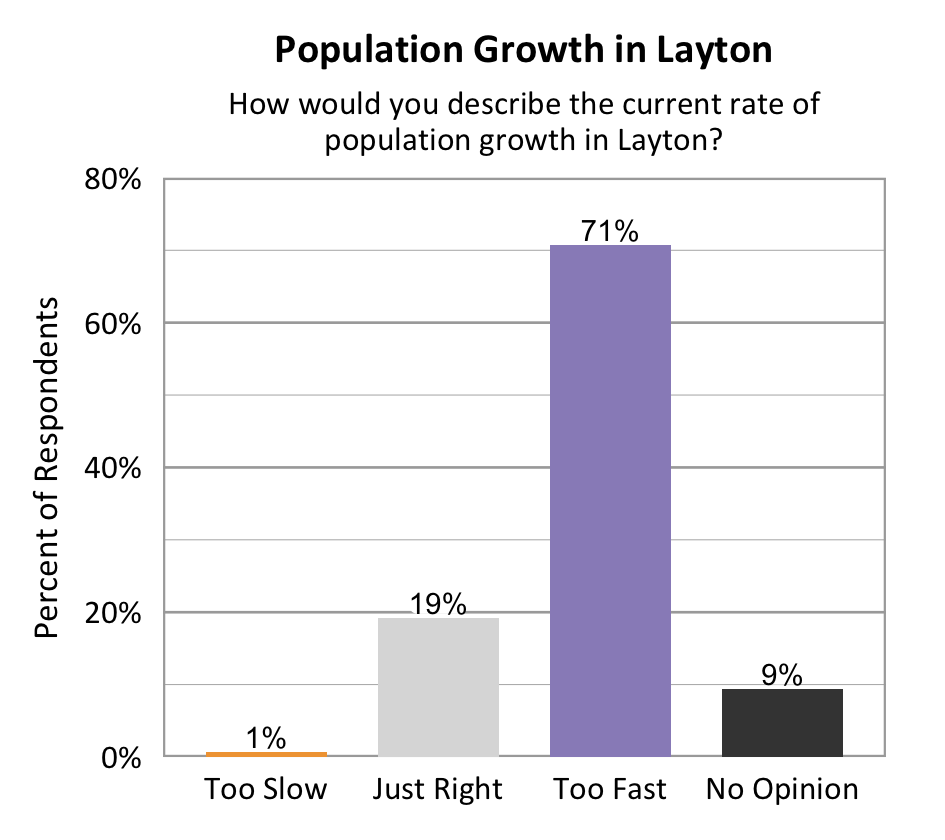
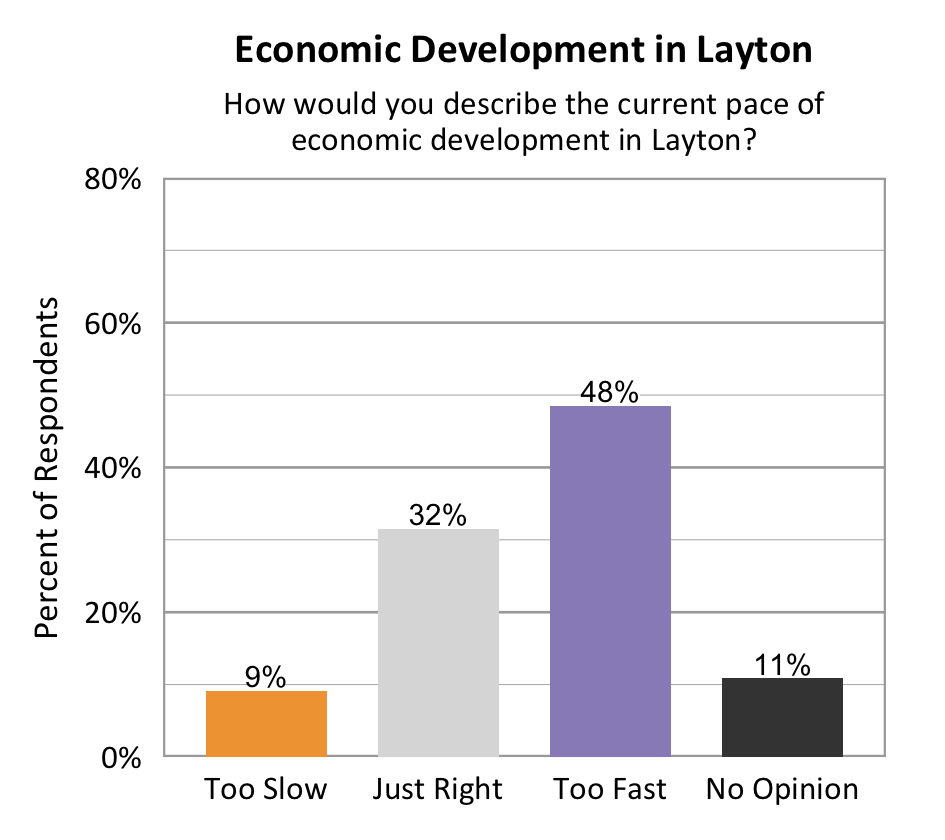
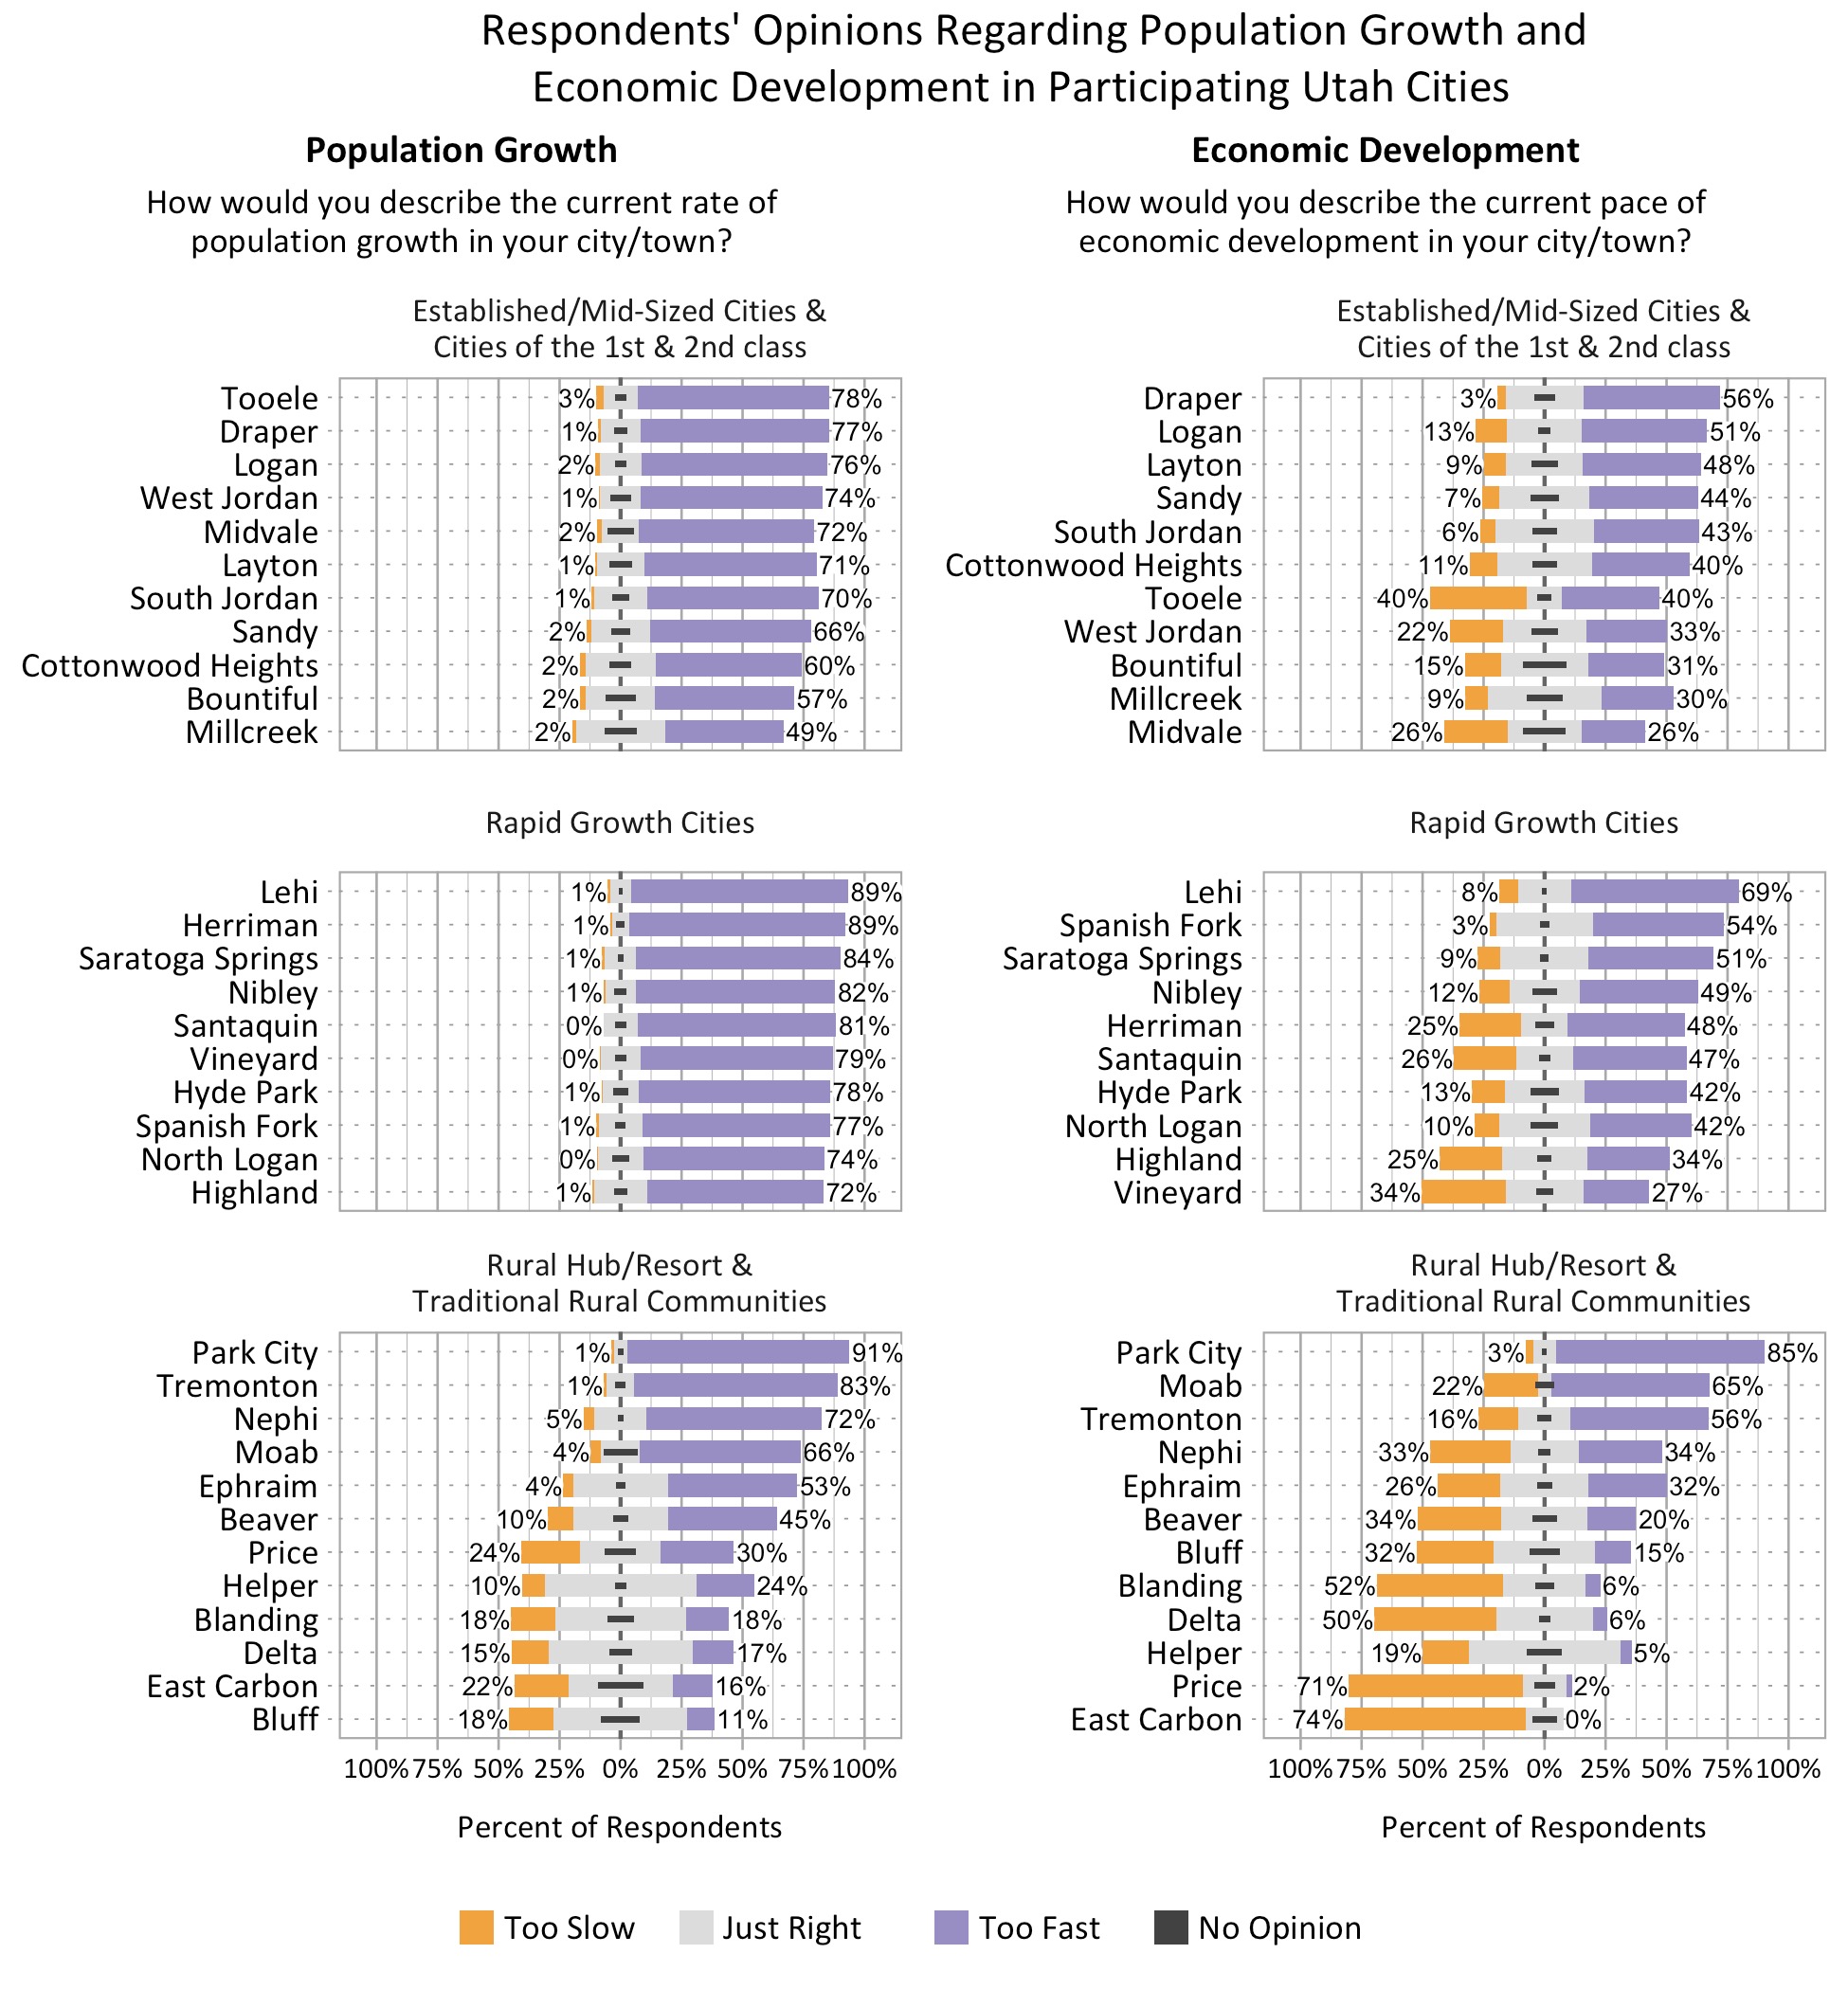
The majority of respondents felt Population Growth was too fast, but attitudes were more divided about the Pace of Economic Development.
Top concerns for the future of Layton were:
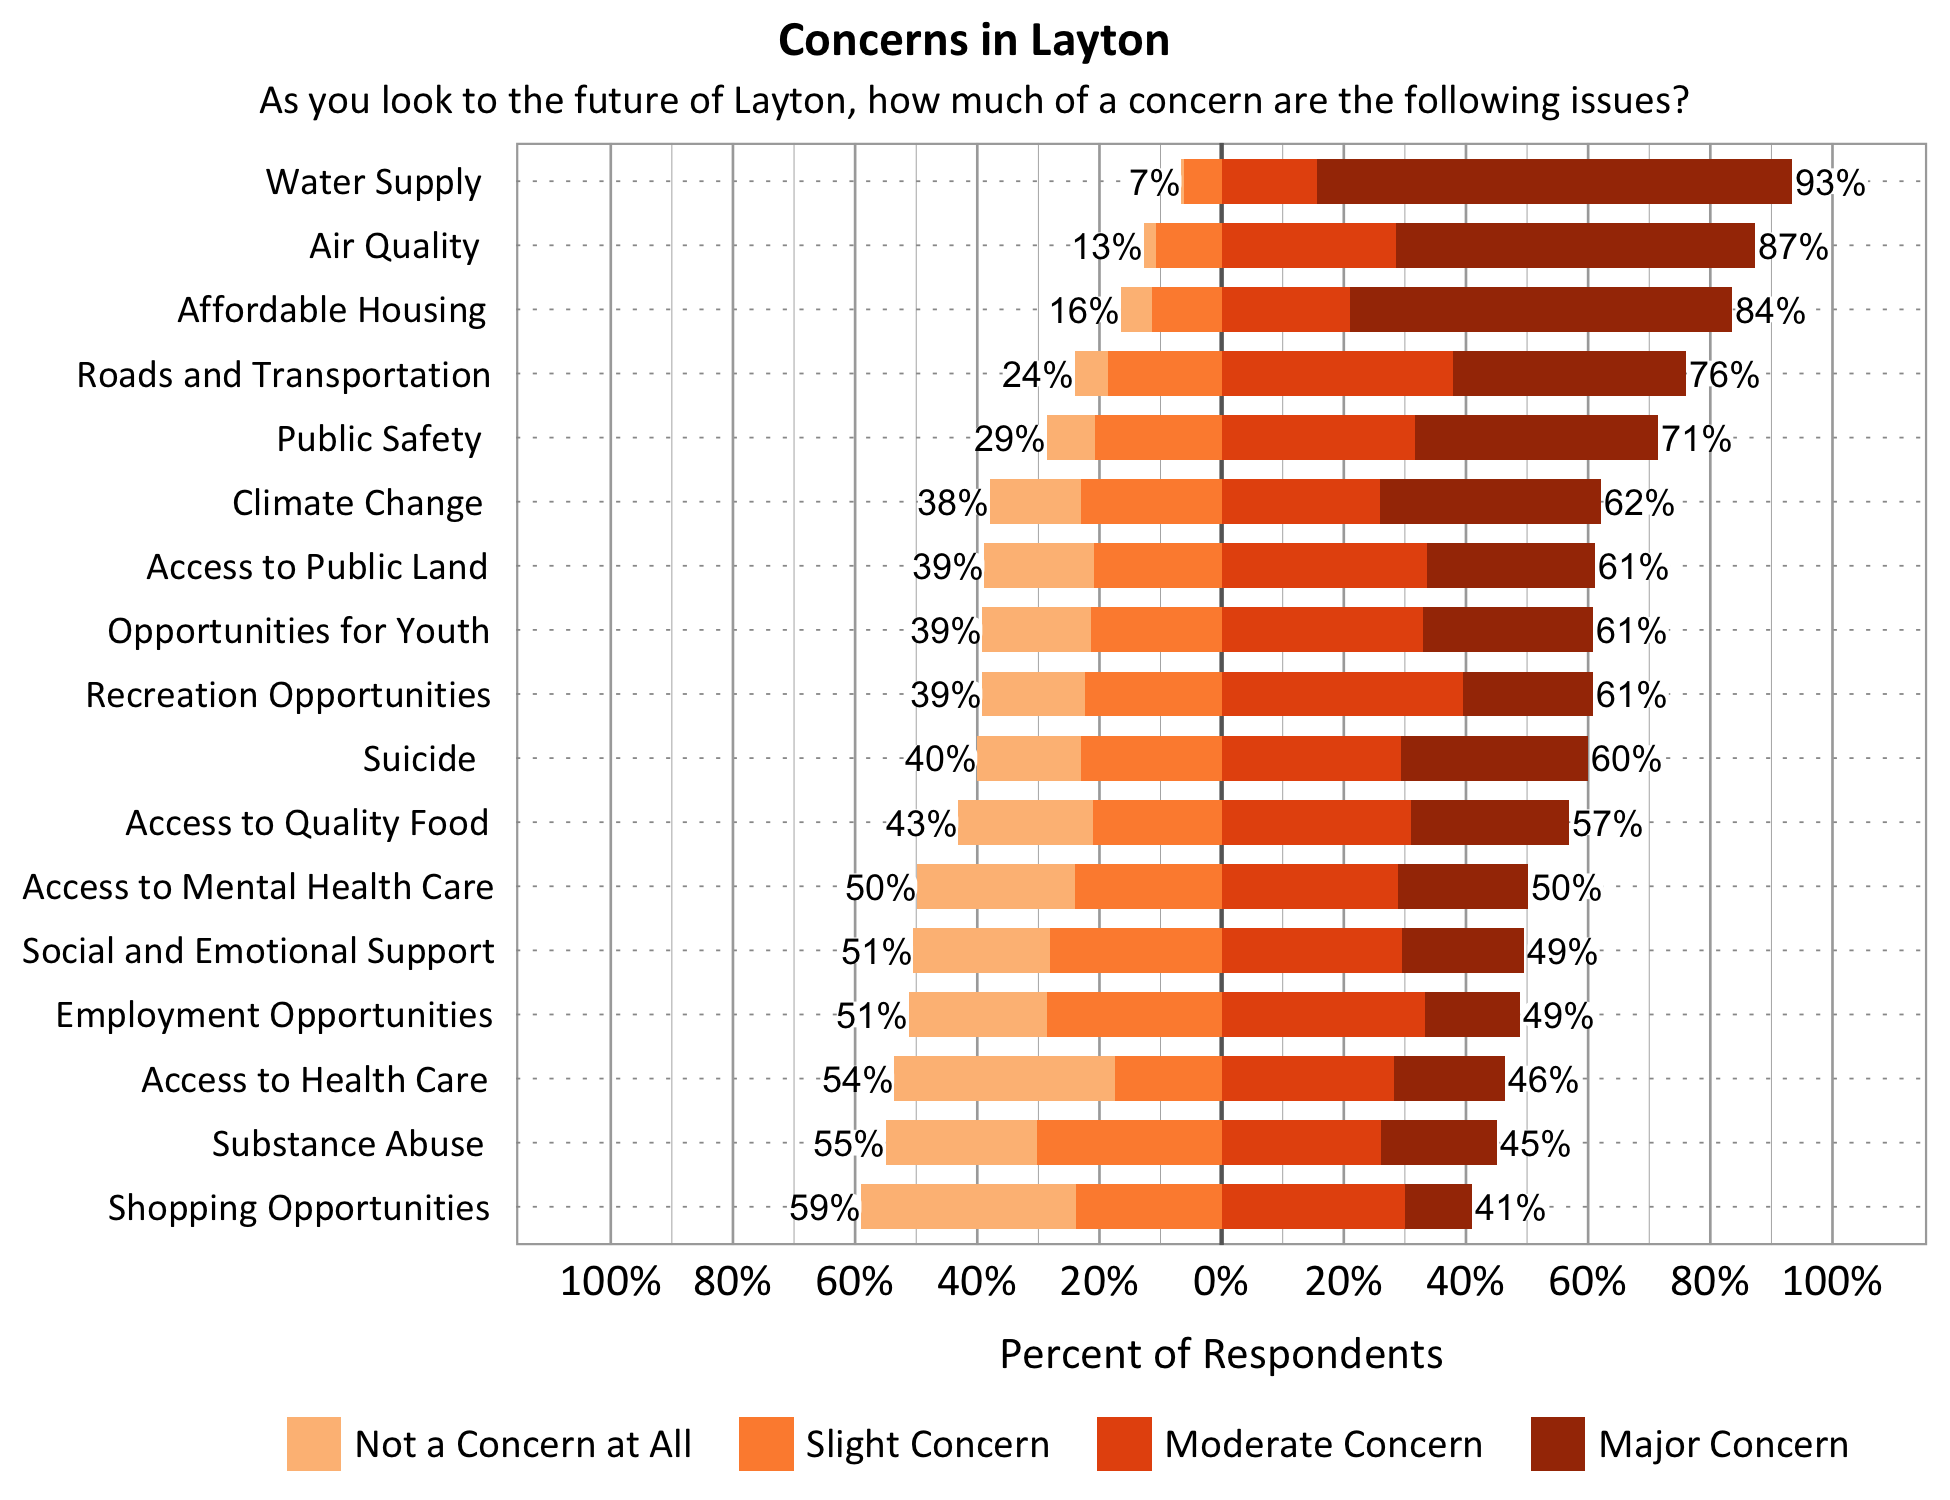
- Water Supply (93% Moderate or Major Concern)
- Air Quality (87% Moderate or Major Concern)
- Affordable Housing (84% Moderate or Major Concern)
- Roads and Transportation (76% Moderate or Major Concern)
What do people value most about Layton?
Positive social social climate, abundant recreation, access to nature and natural beauty, sense of safety
Key Wellbeing Issues and Resource Areas
In addition to providing partner cities with the opportunity to take part in surveys, the Utah Wellbeing Project has worked to provide curated resources for community leaders and citizens that aim to improve specific aspects of wellbeing. These Wellbeing Resources can be found on the Utah Wellbeing Project Website, along with other useful tools and information.
Based on results of the 2022 Utah Wellbeing Project Surveys in Layton City, key wellbeing issues include: Air Quality, Water Supply, Local Environmental Quality, and Affordable Housing. Below you will find links to specific wellbeing resource areas we believe may be used to target some of these issues.
Survey Respondent Characteristics
Table 1.1
| Full Time Residents of Layton | 99.1% |
| Part Time Residents of Layton | 0.9% |
| Length of Residency — Range | 0.4- 77 years |
| Length of Residency — Average | 18.1 years |
| Length of Residency — Median | 14 years |
| Length of Residence 5 years or less | 32.92% |
Table 1.2
| Zipcode | Percent of Respondents |
| 84041 | 64.6% |
| 84040 | 34.5% |
| Other | 0.9% |
Demographic characteristics of the survey respondents were compared below with U.S. Census information from the 2016-2020 American Community Survey. As the table shows, 2022 survey respondents were not fully representative of Layton. People who are female, have at least a 4- year college degree, are married, and those who own their home were particularly overrepresented. People age 18-29, those who are employed, and those with incomes between $100,000 and $149,999 were particularly underrepresented. Not all respondents provided demographic information. Weighting was not used in any of the analysis for the findings presented below.
Table 2
Demographic Characteristics of Survey Respondents and U.S. Census Data for Layton
Demographic Characteristics |
Layton Wellbeing Survey | American Community Survey 2016-2020 Estimates |
|
|---|---|---|---|
| Online 2021 403 Respondents |
Online 2022 319 Respondents |
||
| Age 18-29 | 6.7% | 9.0% | 25.3% |
| Age 30-39 | 25.1% | 29.3% | 21.5% |
| Age 40-49 | 31.3% | 22.8% | 19.1% |
| Age 50-59 | 17.3% | 14.1% | 13.2% |
| Age 60-69 | 13.7% | 14.8% | 12.5% |
| Age 70 or over | 5.8% | 10.0% | 8.4% |
| Adult Female | 68.6% | 71.3% | 49.7% |
| Adult Male | 30.8% | 28.7% | 50.3% |
| Adult non-conforming or non-binary |
NA | 0.0% | NA |
| No college degree | 44.9% | 38.8% | 65.4% |
| College degree (4-year) | 55.1% | 61.2% | 34.6% |
| Median household income | NA | NA | |
| Income under $25,000 | 2.7% | 3.1% | 10.0% |
| Income $25,000 to $49,999 | 11.8% | 10.1% | 15.7% |
| Income $50,000 to $74,999 | 18.3% | 17.4% | 19.5% |
| Income $75,000 to $99,999 | 20.7% | 15.3% | 18.3% |
| Income $100,000 to $149,999 | 31.0% | 31.0% | 19.8% |
| Income $150,000 or over | 15.4% | 23.0% | 16.7% |
| Church of Jesus Christ of Latter-day Saints | 61.7% | 60.1% | NA |
| Other religion | 19.8% | 19.6% | NA |
| Agnostic/Atheist/No religious preference | 18.6% | 20.3% | NA |
| Hispanic/Latino | 4.8% | 7.7% | 13.4% |
| White | 94.6% | 94.8% | 85.7% |
| Nonwhite | 5.4% | 5.2% | 14.3% |
| Married | 84.8% | 82.8% | 57.6% |
| Children under 18 in household | 59.5% | 52.5% | 43.8% |
| Employed | 63.7% | 56.7% | 69.4% |
| Out of work and looking for work | 1.5% | 1.0% | 1.6% |
| Other | 36.8% | 42.2% | 28.2% |
| Own home/Owner occupied | 90.0% | 90.0% | 72.0% |
| Rent home/Renter occupied/Other | 10.0% | 10.0% | 28.0% |
Overall Personal Wellbeing and Overall Wellbeing in Layton
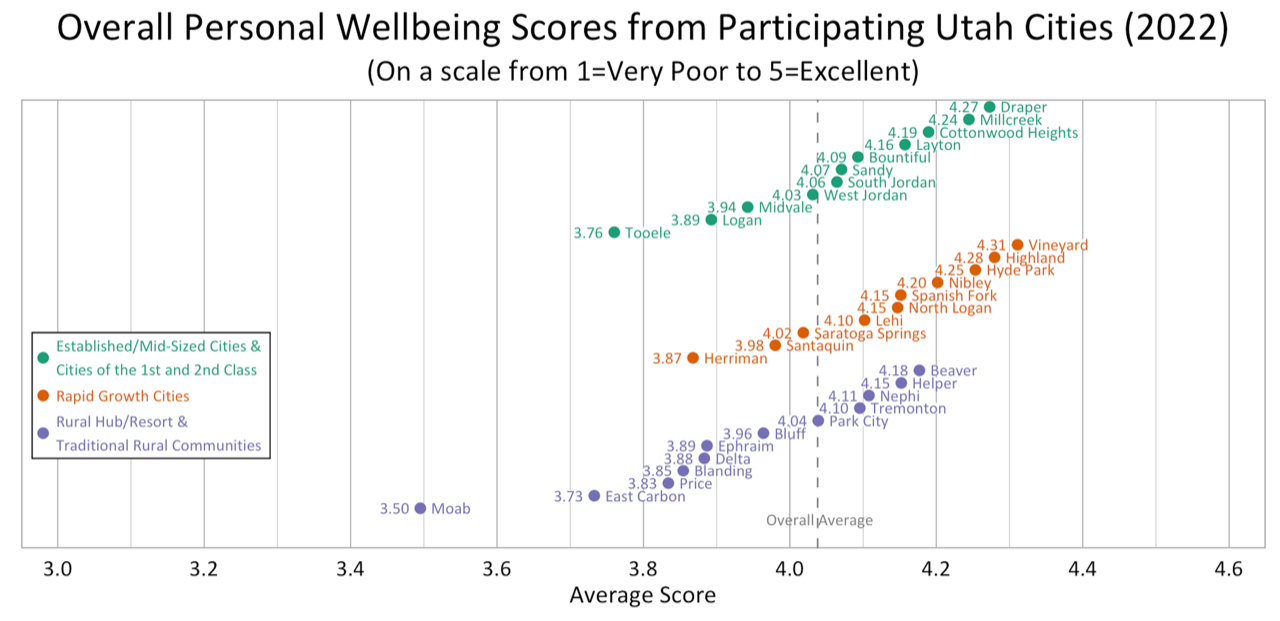
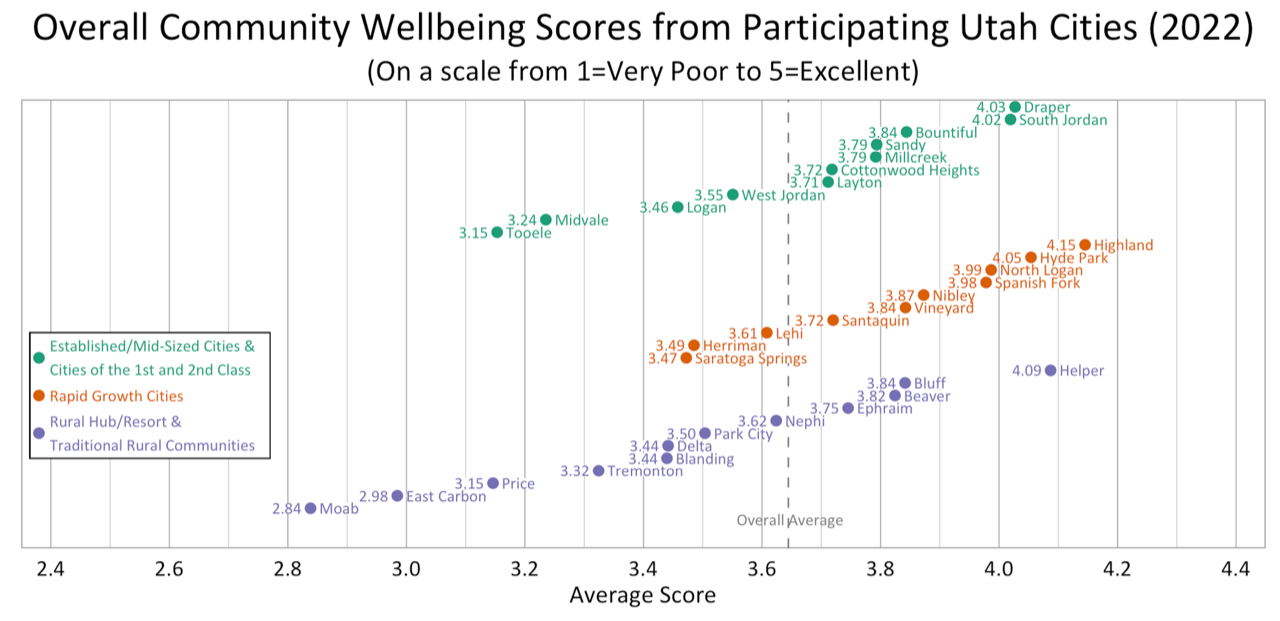
Survey participants were asked about their overall personal wellbeing and overall community wellbeing in Layton. These wellbeing indicators were both measured on a 5-point scale from very poor (1) to excellent (5). The average personal wellbeing score in Layton was 4.16 with 86% of respondents indicating their wellbeing at a 4 or 5 on the 5-point scale. The average score for community wellbeing in Layton was 3.71 with 62% of respondents indicating city wellbeing at a 4 or 5 on the 5-point scale.
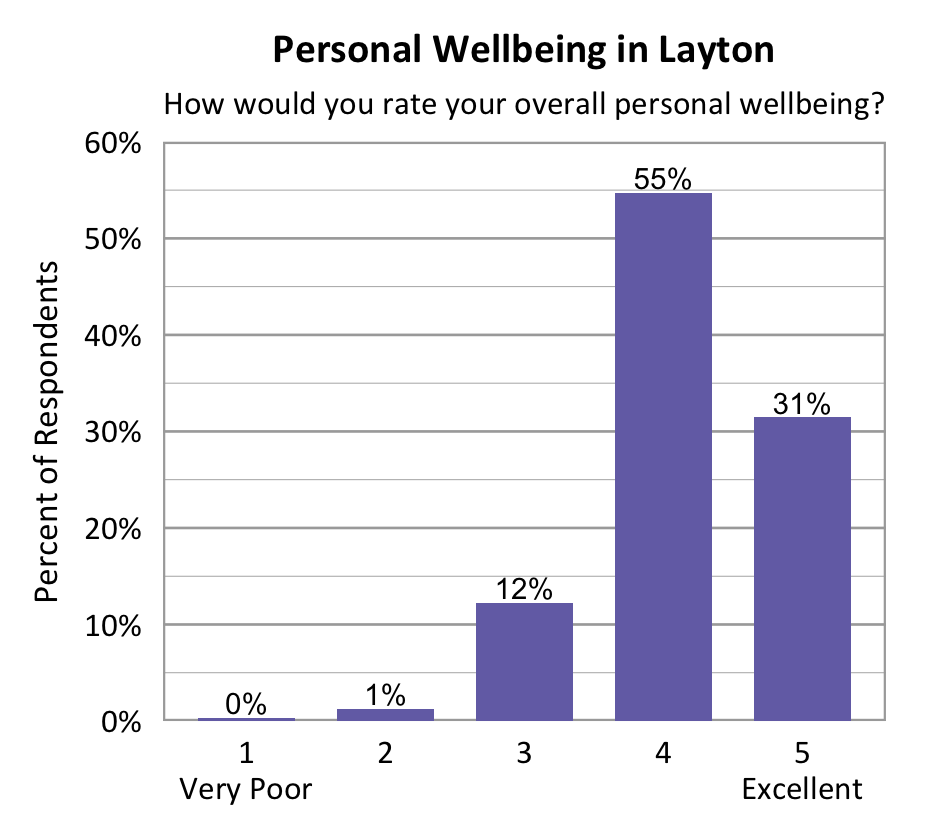
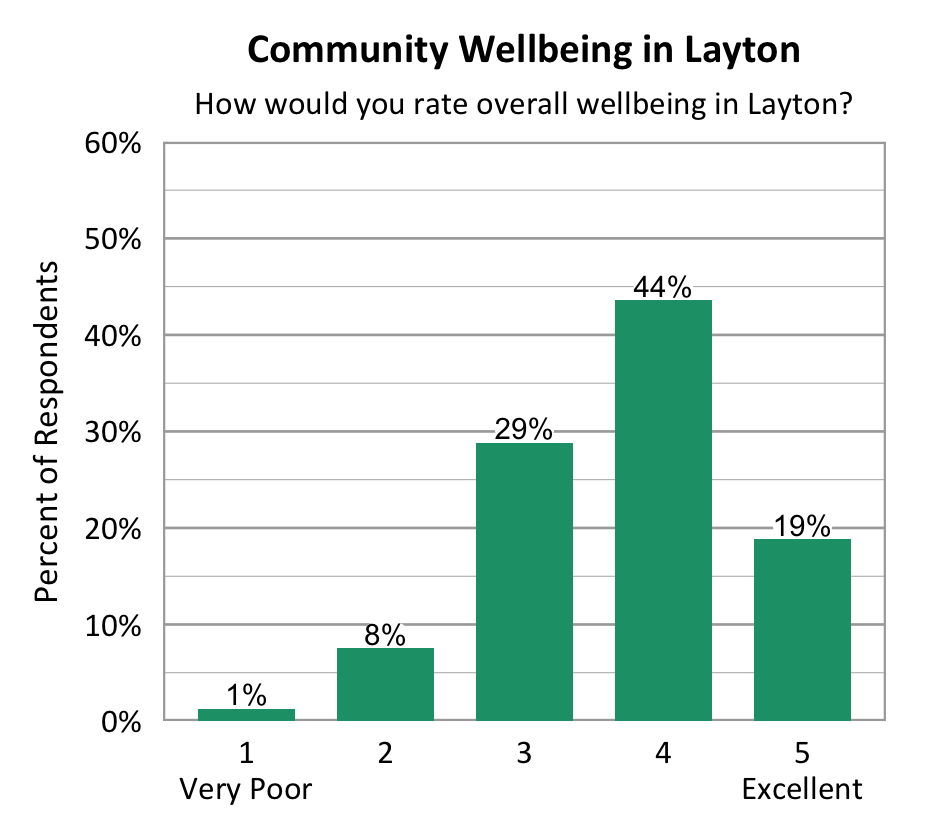
Overall personal wellbeing and community wellbeing were higher for those in zipcode 84040, but this difference was not statistically significant.
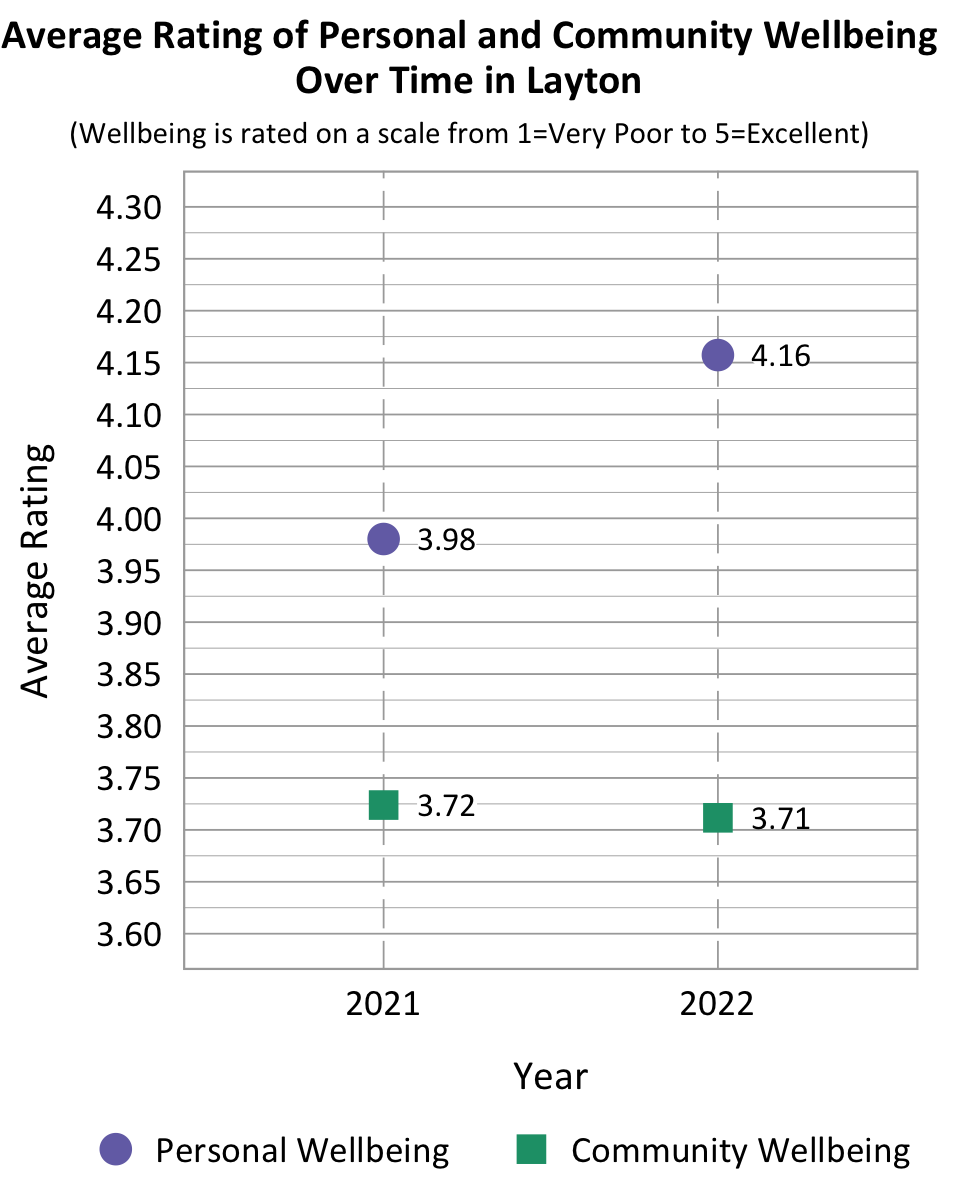
Comparing survey data from Layton over the years as shown in the information below, we can see that the average personal wellbeing score increased and the community wellbeing score stayed nearly the same. Note that the number of respondents differed between years and there is no tracking of individuals from one year to the next.
Comparing Wellbeing Across Utah Cities
The Utah League of Cities and Towns classifies Layton as a City of the 1st & 2nd Class (and we have combined these with Mid-Sized Cities). Some cities may fit within more than one cluster.
Within the more urban city cluster, Layton fell above the cluster average in terms of the average overall personal wellbeing score and below average in terms of average community wellbeing score. Layton was statistically significantly higher than Tooele, Logan, and Midvale in terms of overall personal wellbeing. In terms of community wellbeing, Layton was significantly higher than Tooele, Midvale, and Logan, but statistically significantly lower than South Jordan and Draper. Margins of error are particularly high for Delta, Helper, Midvale, and Santaquin due to low survey response.
Wellbeing Domains in Layton
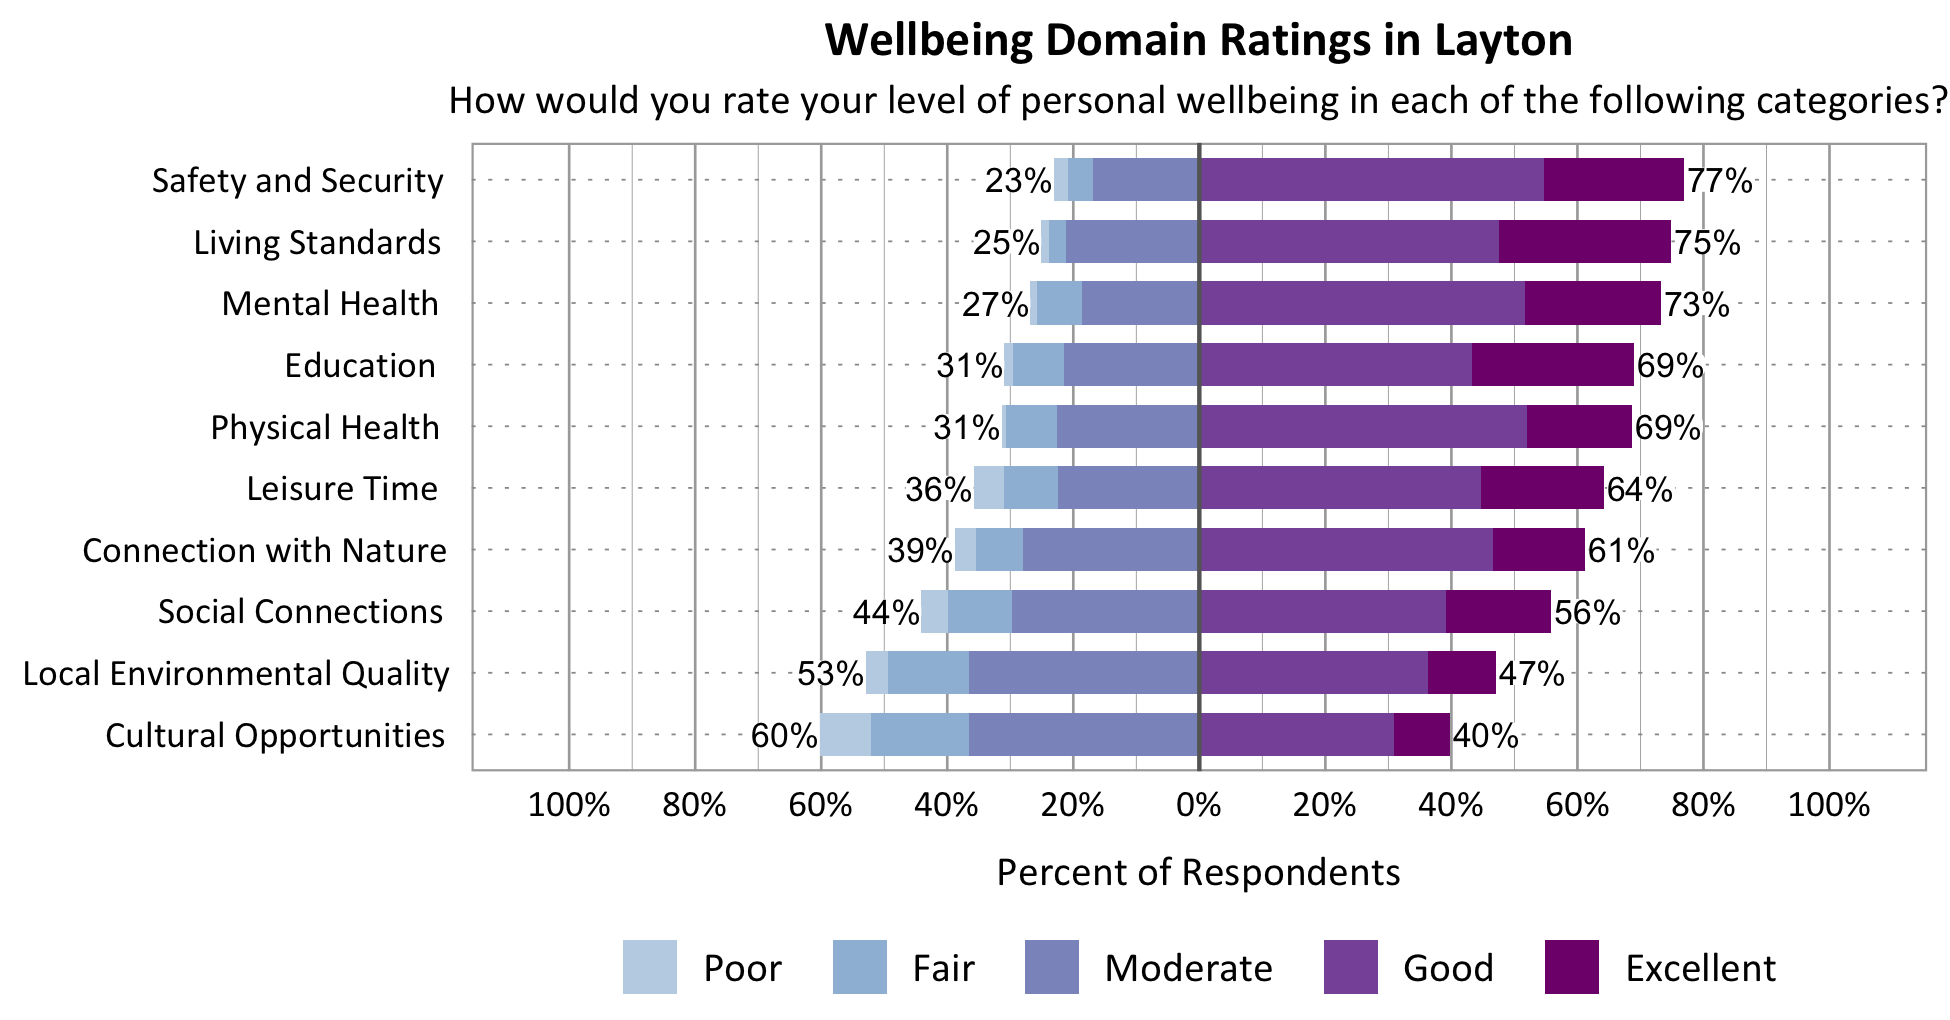
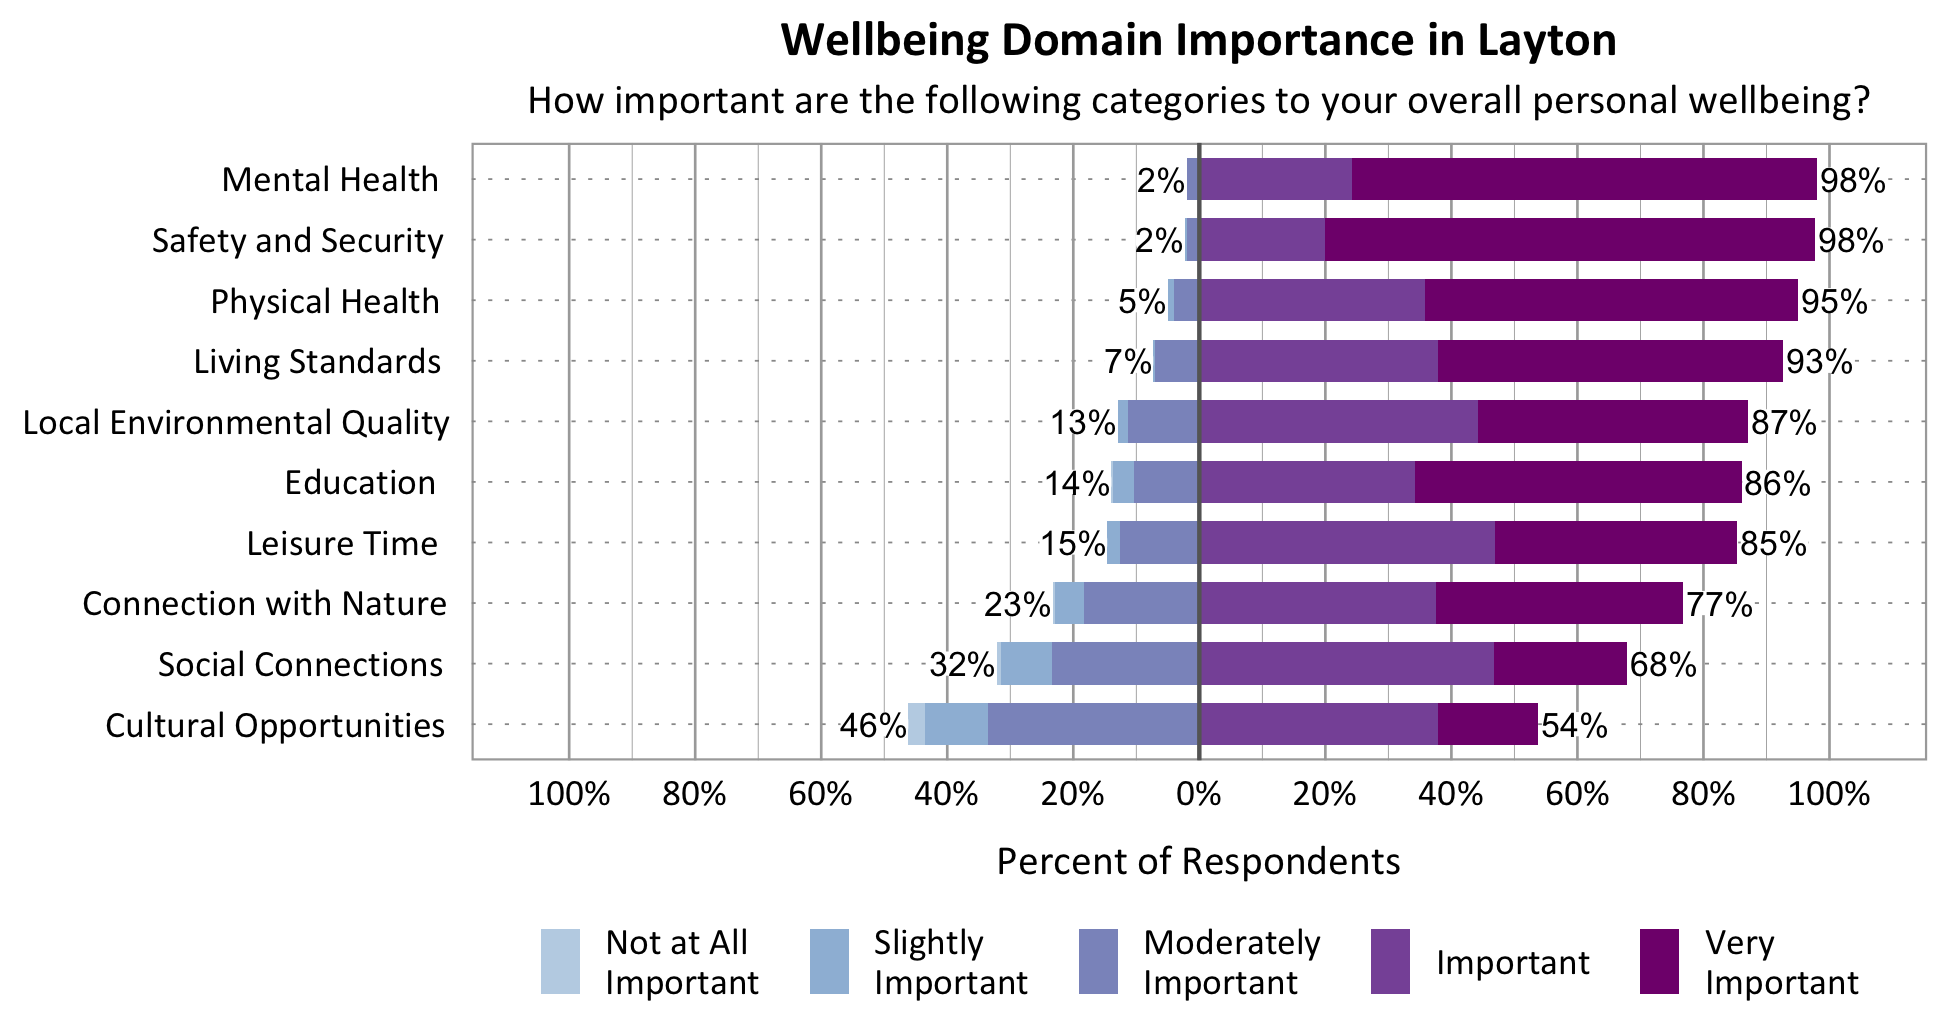
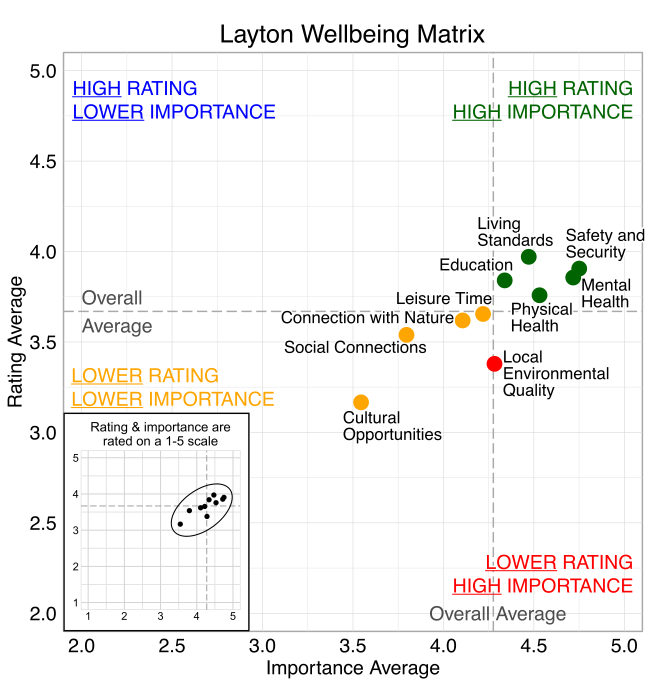
According to national and international entities that track wellbeing, there are a number of common dimensions or domains of wellbeing. In this survey, respondents rated ten domains on a 5-point scale from poor to excellent, suggesting how their wellbeing was doing in each area. They were also asked to indicate the importance of each domain to their overall personal wellbeing on a 5-point scale from not at all important to very important. The top three highest rated wellbeing domains for respondents in Layton were Safety and Security (77%), Living Standards (75%), and Mental Health (73%). The four most important wellbeing domains were Mental Health (98%), Safety and Security (98%), Physical Health (95%), and Living Standards (93%).
Wellbeing Matrix for Layton
The graph below illustrates the relationship between the average rating and the average importance of wellbeing domains for survey respondents from Layton. Mental Health, Safety and Security, Physical Health, Education, and Living Standards were highly important and rated above average among the domains. Local Environmental Quality fell in the “red zone” of higher importance, but lower ratings.
Wellbeing Domains Over Time in Layton
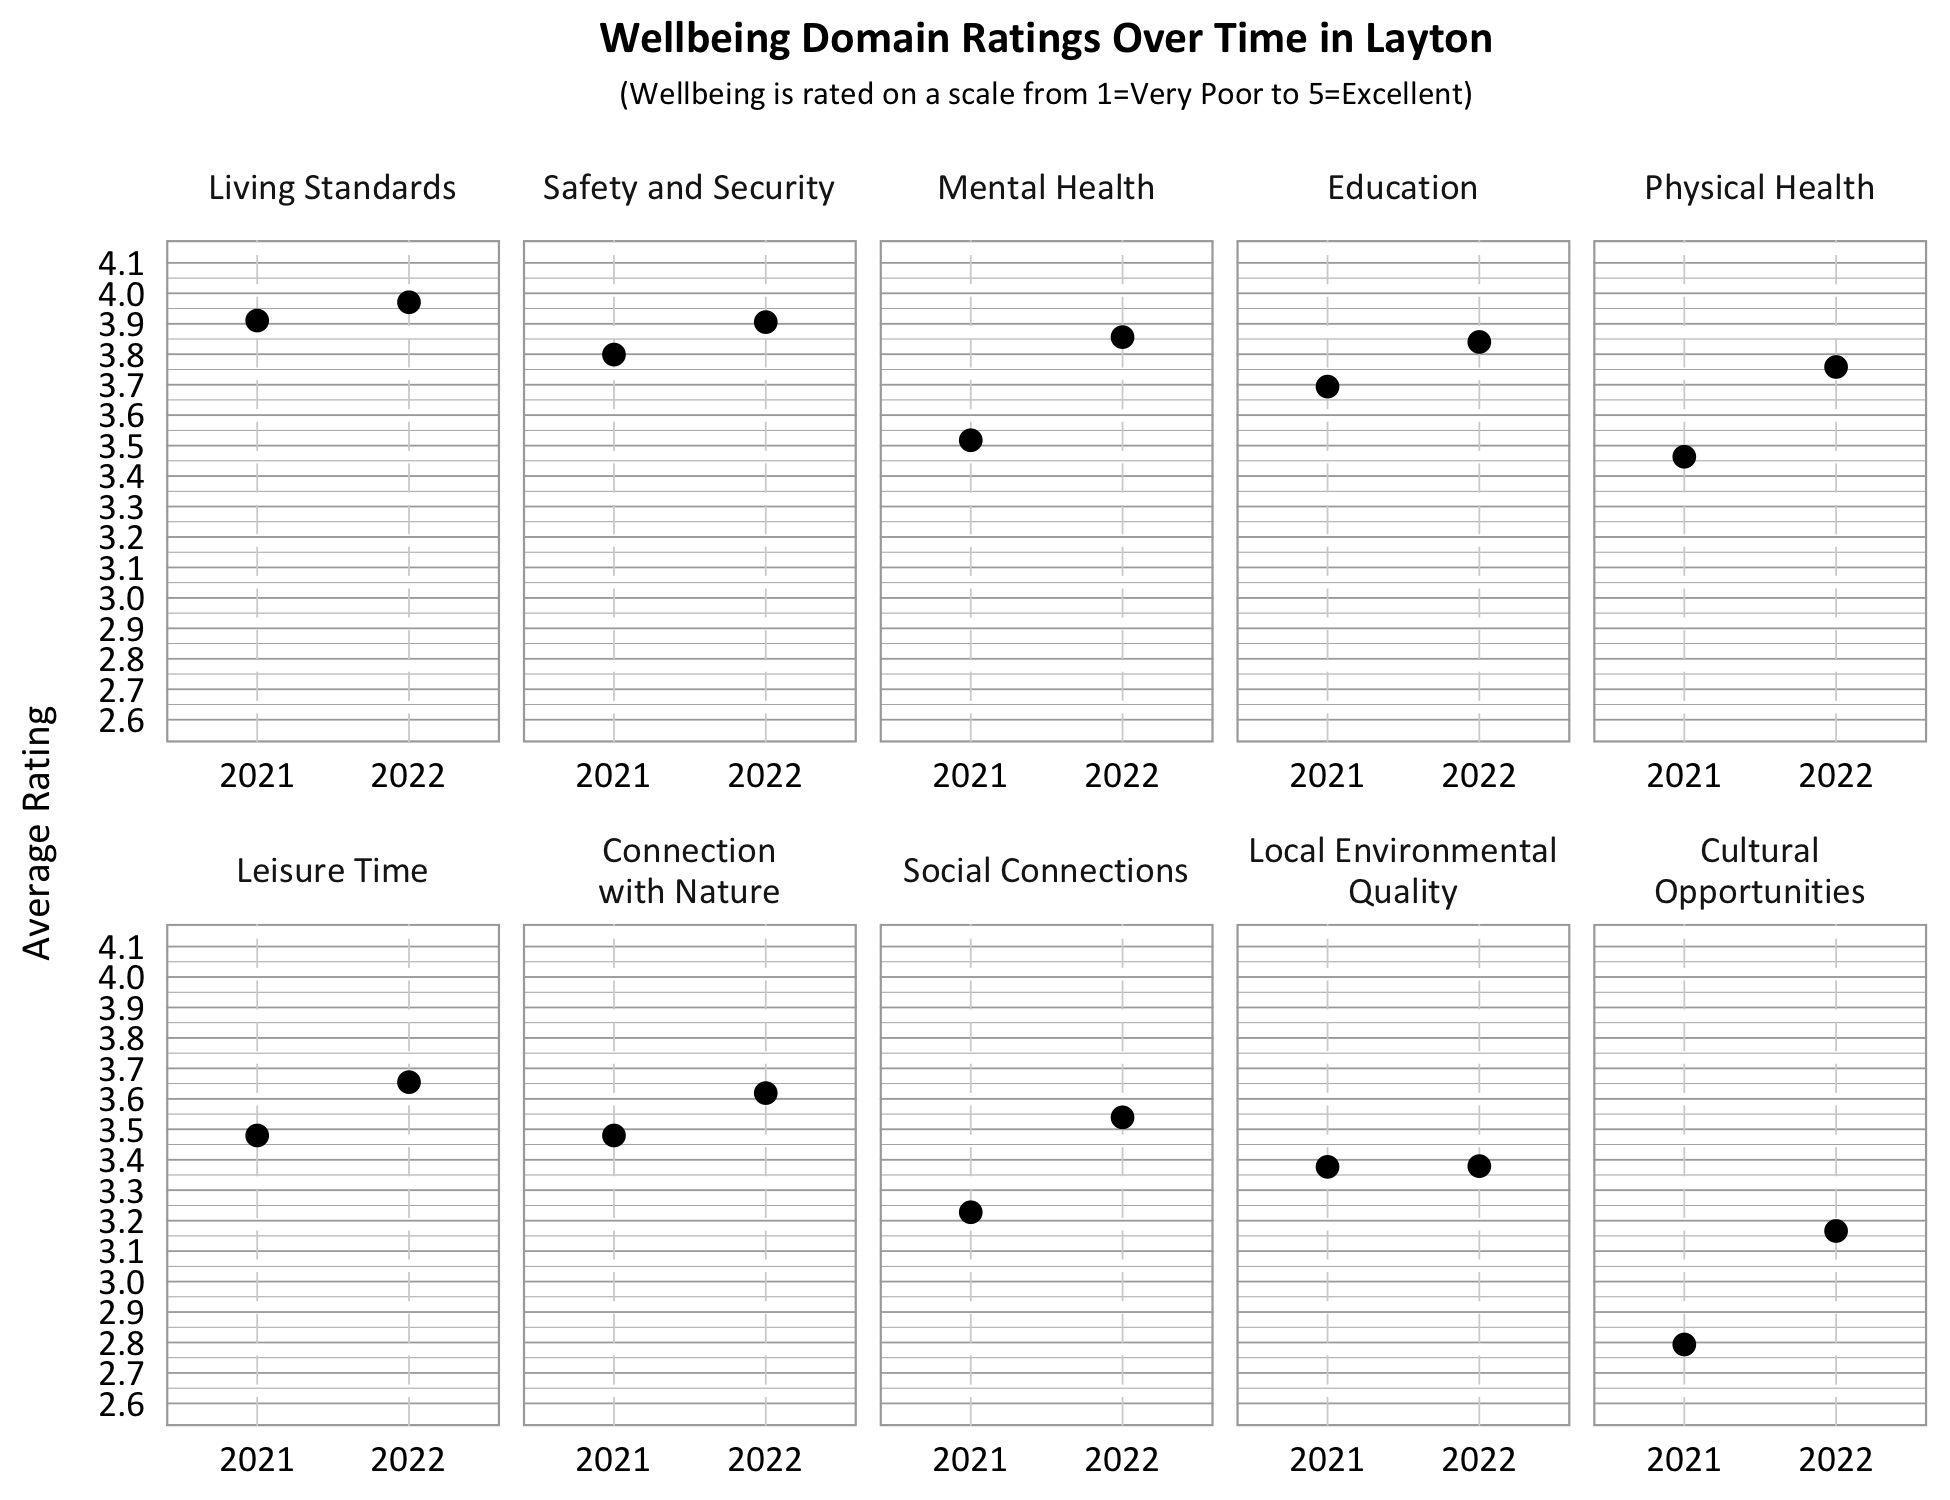
The graphs below show how the domains were rated in 2021 and 2022 by Layton residents. There was considerable improvement in wellbeing domain ratings in the last year! The number of respondents changed over time and individuals were not tracked.
How are Demographic Characteristics Related to Wellbeing?
The demographic variables for age, gender, college degree, religion, income, and length of residence were found to have varying relationships among Layton respondents as shown in the table below based on a generalized linear model with unweighted data. The +/- sign indicates whether the wellbeing score in the specific demographic group was significantly higher or lower than the reference group in each demographic variable (p<.05).
Table 3
Relationship Between Demographic Characteristics and Wellbeing Domains in Layton
| Domains Rated | Demographic Variables | |||||
|---|---|---|---|---|---|---|
| Age 60+ | Female | College Degree | Latter-day Saint | Highest Income ($150,000+) |
Resident 5 Years or Less | |
| Wellbeing Ratings | ||||||
| Overall Personal Wellbeing | + vs 40-59 |
+ |
||||
| Wellbeing in Layton | ||||||
| Connection with Nature | + |
+ vs A/A/NP |
+ vs Under $75,000 |
|||
| Cultural Opportunities | + |
+ |
+ vs Under $75,000 |
|||
| Education | + |
+ |
+ vs Under $75,000 |
|||
| Leisure Time | + vs 40-59 |
+ vs A/A/NP |
||||
| Living Standards | + |
+ vs Under $75,000 |
||||
| Local Environmental Quality | + vs 40-59 |
+ |
+ vs Under $75,000 - $99,999 |
|||
| Mental Health | + |
+ |
+ vs Under $75,000 |
|||
| Physical Health | ||||||
| Safety & Security | + vs Other |
|||||
| Social Connections | + |
+ |
||||
| Age 60+ | Female | College Degree | Latter-day Saint | Highest Income ($150,000+) |
Resident 5 Years or Less | |
| Domains | Domain Importance | |||||
| Connection with Nature | ||||||
| Cultural Opportunities | + vs 18-39 |
+ |
||||
| Education | + vs Other |
|||||
| Leisure Time | + | |||||
| Living Standards | ||||||
| Local Environmental Quality | + vs $100,000- $149,999 |
|||||
| Mental Health | + |
+ vs Under $75,000 |
||||
| Physical Health | + vs 40-59 |
+ |
+ vs Under $75,000 and $100,000-$149,999 |
|||
| Safety and Security | + vs A/A/NP |
|||||
| Social Connections | + |
+ vs A/A/NP |
||||
Community Action and Connection in Layton
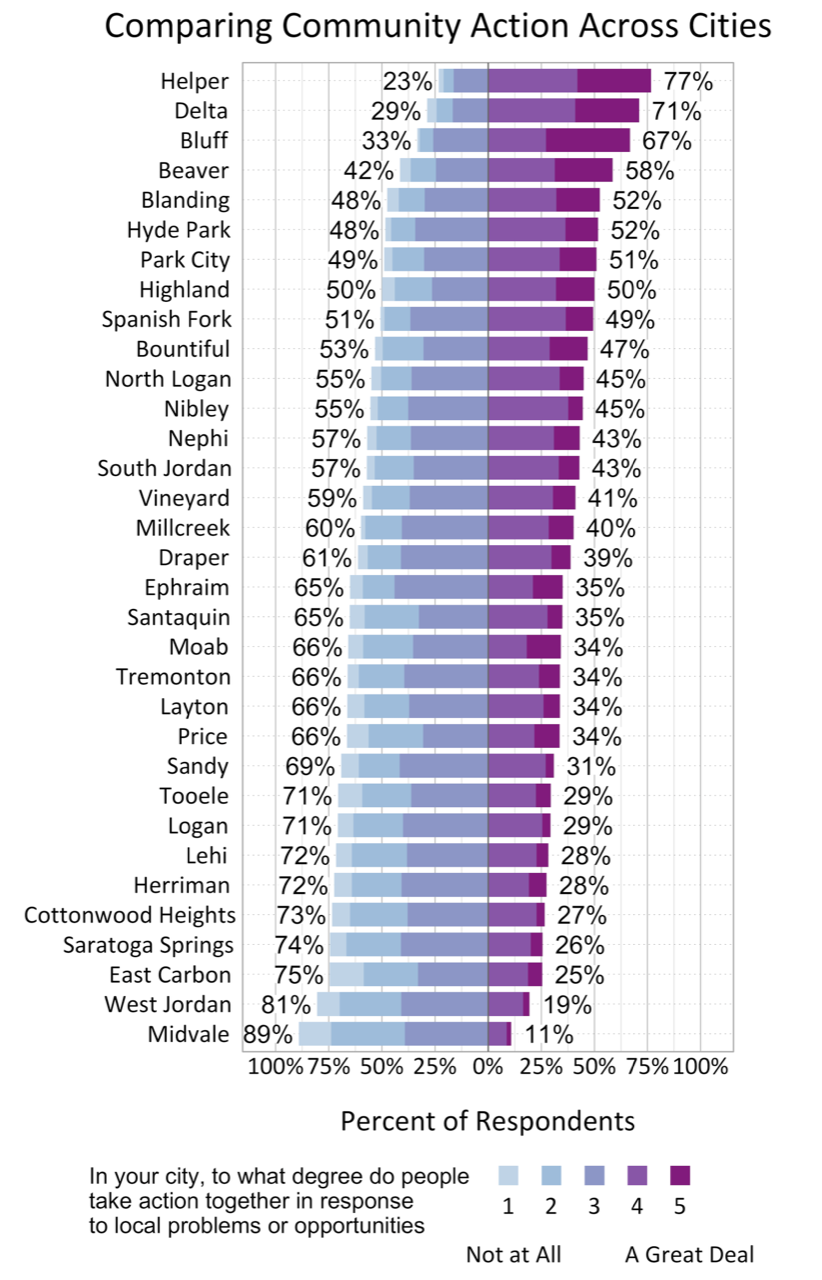
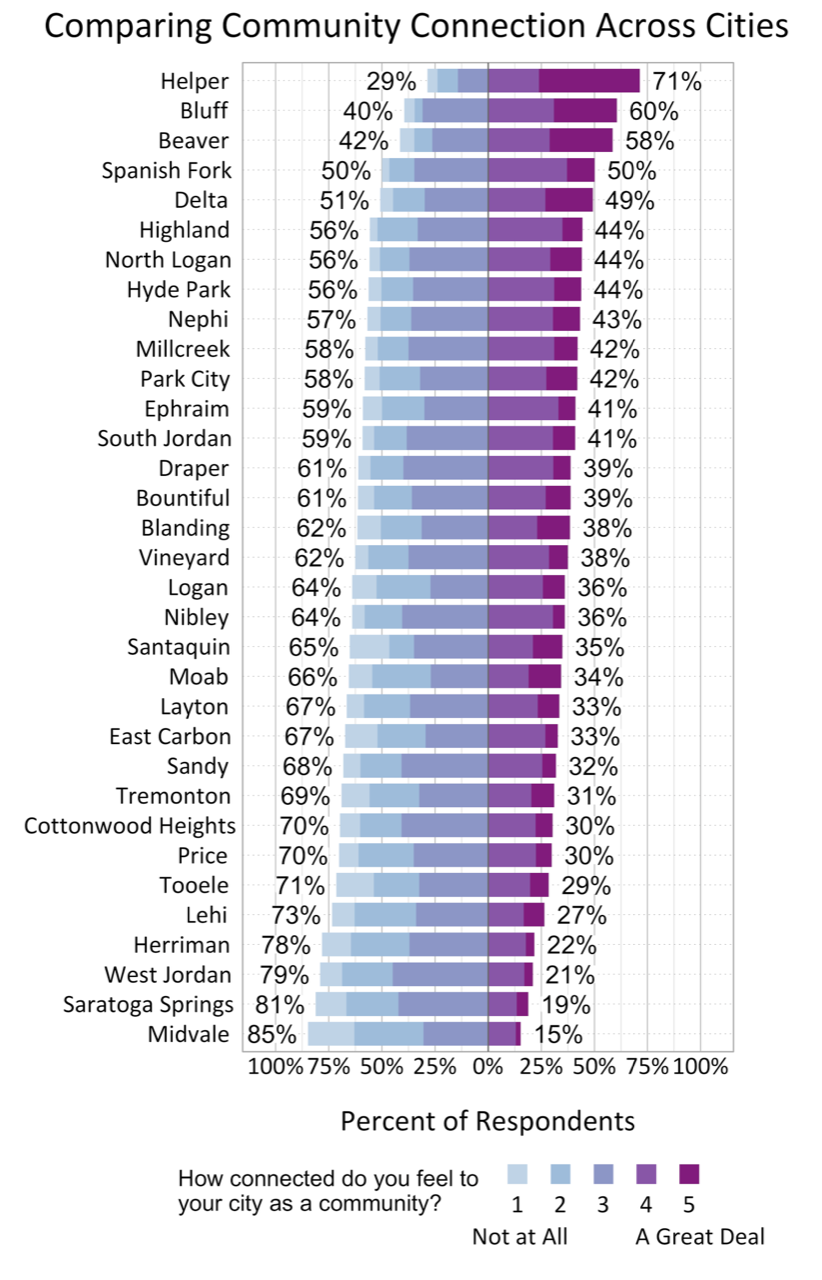
Survey participants were asked about community actions and community connection in Layton. Both questions were scored on a 5-point scale from not at all (1) to a great deal (5). When asked about the degree to which people take action together in response to local problems or opportunities in Layton, the average score was 3.04. When asked about the degree they feel connected to their community, the average score was 3.06.
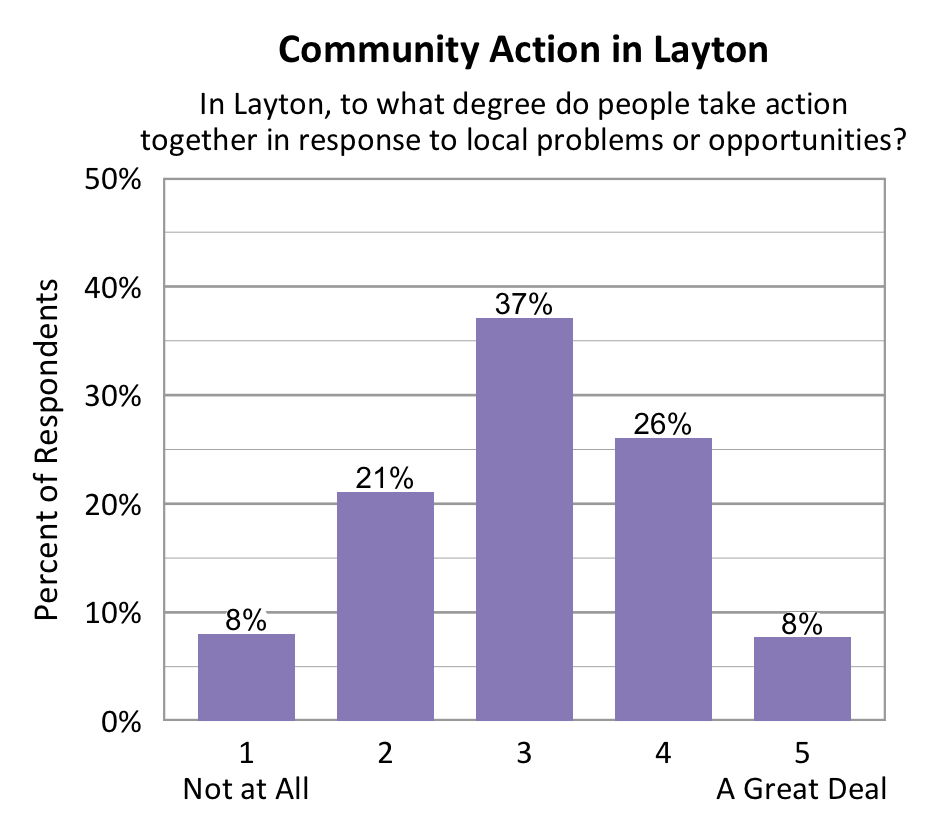
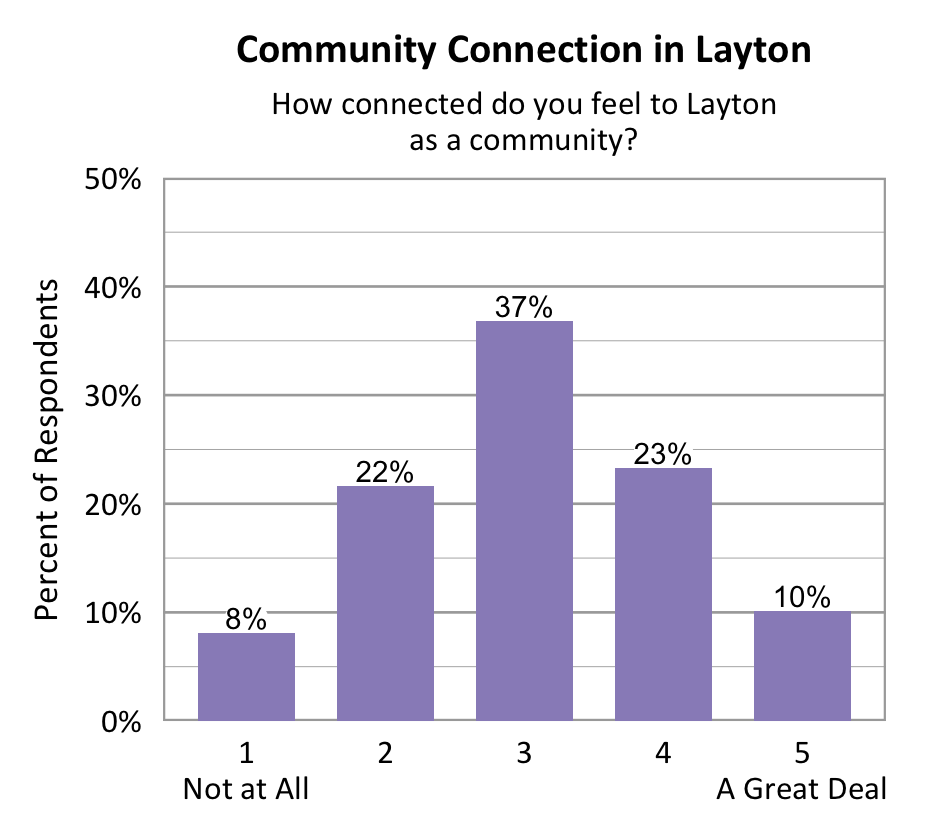
Latter-day Saints reported higher levels of community connection and higher perceptions of local action than those who indicated Agnostic/Atheist/No Religious Preference or those from other religions. Respondents age 60+ reported higher levels of community connection and higher perceptions of local action than those age 40-59. Respondents in the highest income category ($150,000+) reported higher levels of community connection than those with household incomes under $75,000, and higher perceptions of local action than those with household incomes ranging from under $75,000 to $99,999. This was based on a generalized linear model with unweighted data (p < 0.05).
Table 4
Demographic Characteristics and Community Questions
| Community Questions | Age 60+ | Female | College Degree | Latter-day Saint | Highest Income ($150,000+) |
Resident 5 Years or Less |
|---|---|---|---|---|---|---|
| Do people in Layton take action? | + vs 40-59 |
+ |
+ vs Under $75,000 |
|||
| Do you feel connected to your community? | + vs 40-59 |
+ | + vs Under $75,000- $99,999 |
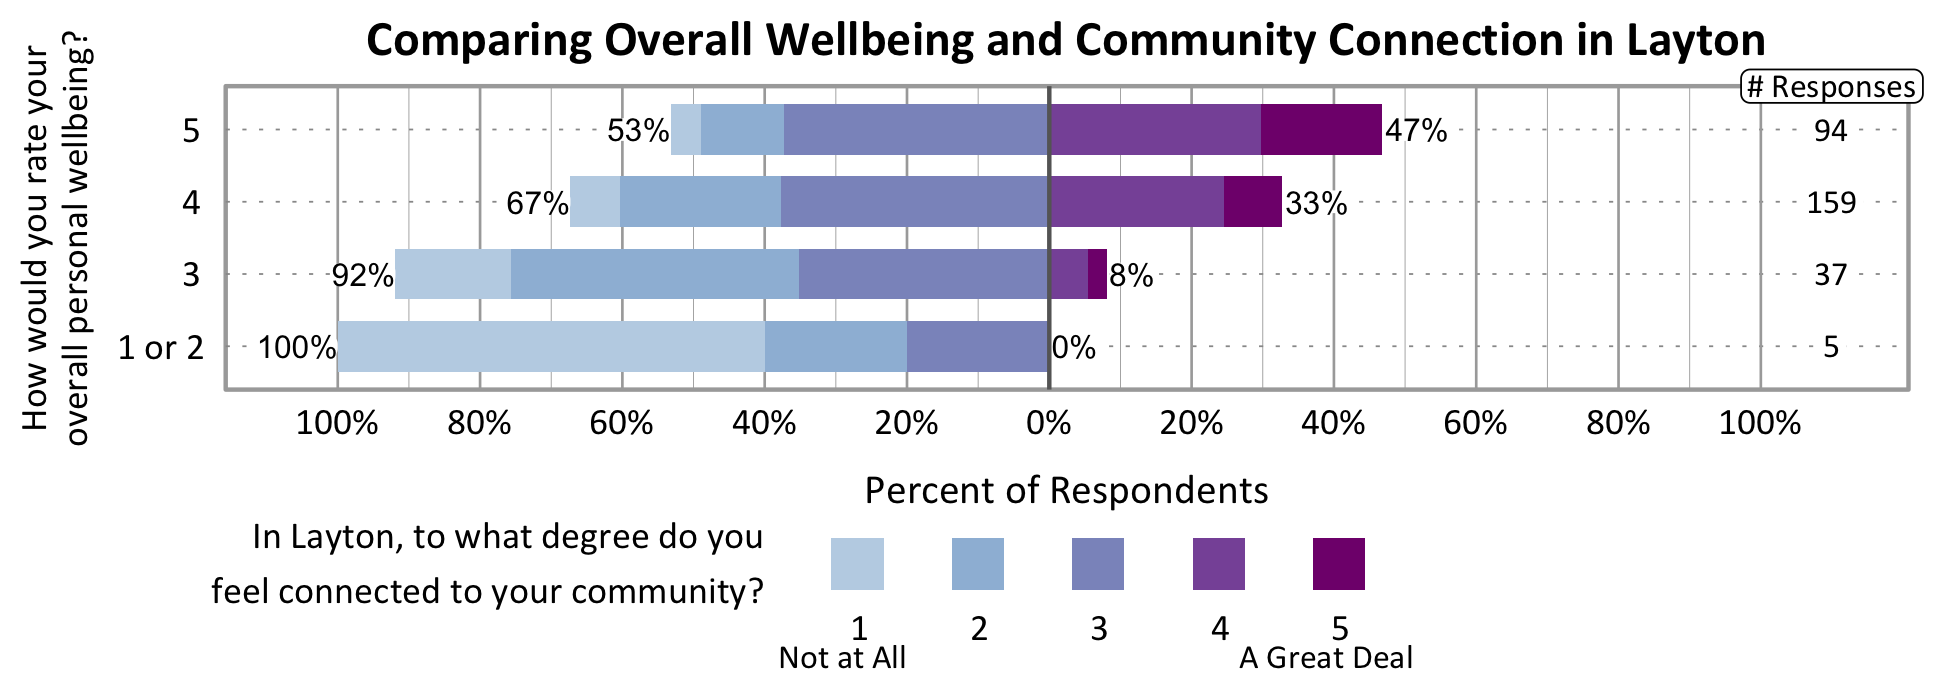
A significant, positive relationship was found between individuals’ community connection and overall personal wellbeing.
Comparing Community Action and Connection Across Cities
The graphs below show how Wellbeing Project cities compare on the degree to which people take action in response to local problems and opportunities and how connected people feel to their city as a community. Layton was in the lower half on perceived community action and community connection based on the number of people indicating a 4 or 5 on a 5-point scale. Margins of error are particularly high for Delta, Helper, Midvale, and Santaquin due to low survey response.
Participation in Recreation and Nature-Related Activities
Respondents were asked to indicate whether or not they participated in eight different recreation or nature-based activities in the past 12 months. Enjoying wildlife and birds in your yard or neighborhood (82%) was the most common activity for respondents, followed by recreating in parks in the city (80%), gardening (77%), and non-motorized recreation on public lands or waters (77%).
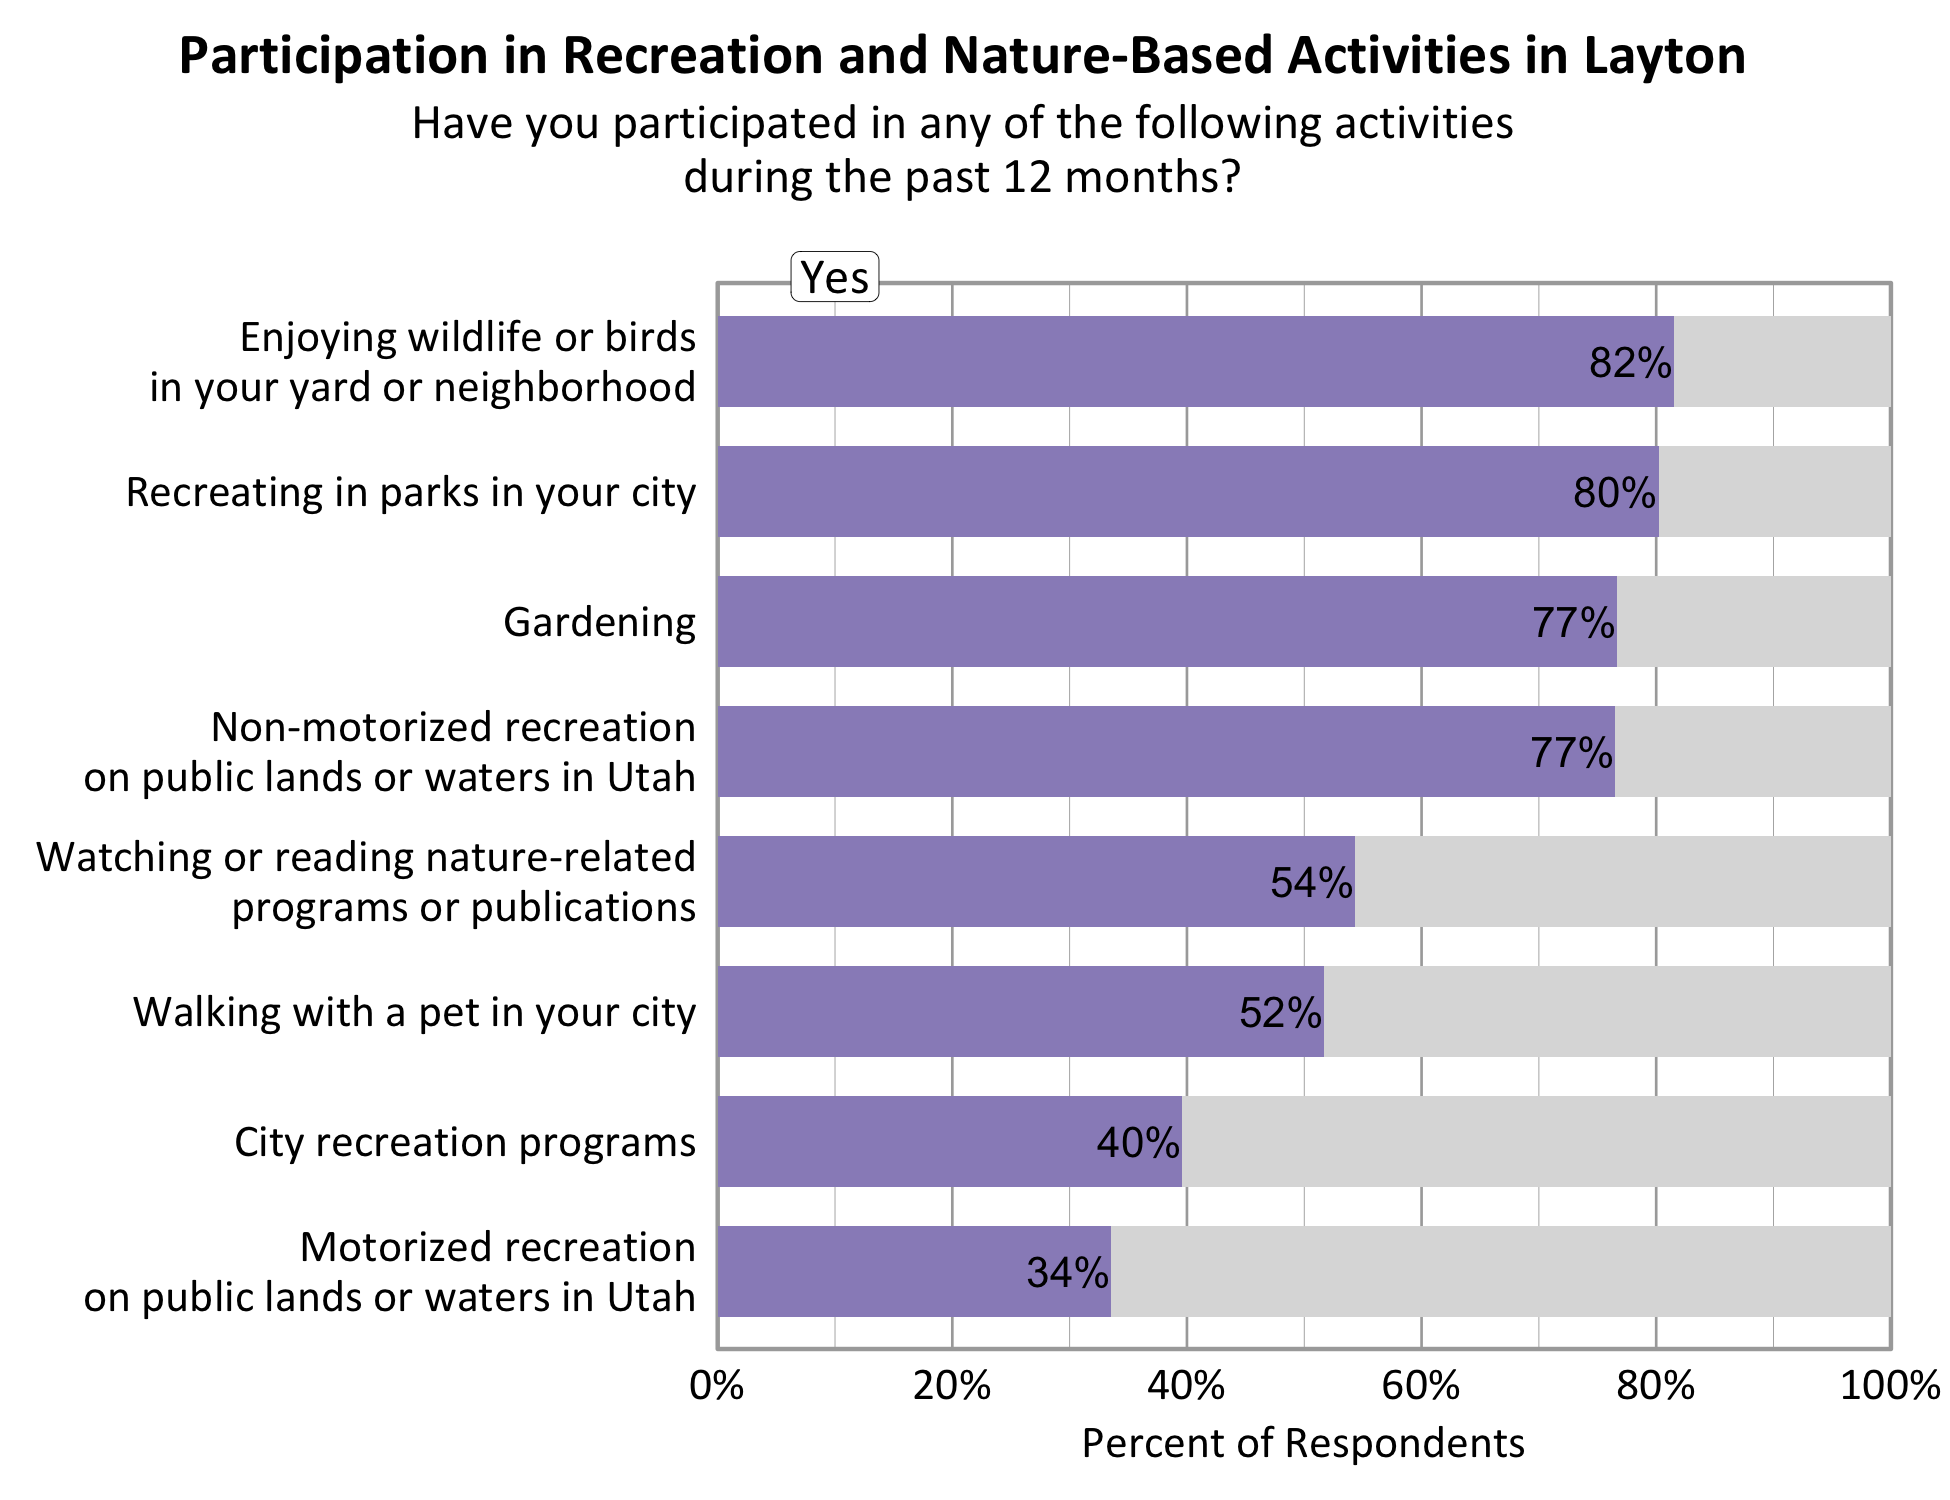
For Layton respondents, participating in non-motorized recreation on Utah public lands or waters and enjoying wildlife and birds in yard or neighborhood were positively and significantly related to overall personal wellbeing.
Enjoying wildlife and birds in yard or neighborhood was positively and significantly related to community wellbeing.
All activities except walking a pet in city or watching or reading nature-related programs or publications were positively and significantly related to community connection.
Influence of Landscape on Wellbeing
Survey participants were asked about the influence of landscape features on their wellbeing. Natural landscapes including mountains, city parks, trails, rivers and streams were found to have an overwhelmingly positive influence on wellbeing. In terms of development and industry in the landscape, respondents were more divided.

Perspectives on Population Growth and Economic Development
The majority of Layton survey respondents indicated they felt population growth was too fast (71%). On the pace of economic development, 48% indicated it was too fast, 32% just right, and 9% too slow.
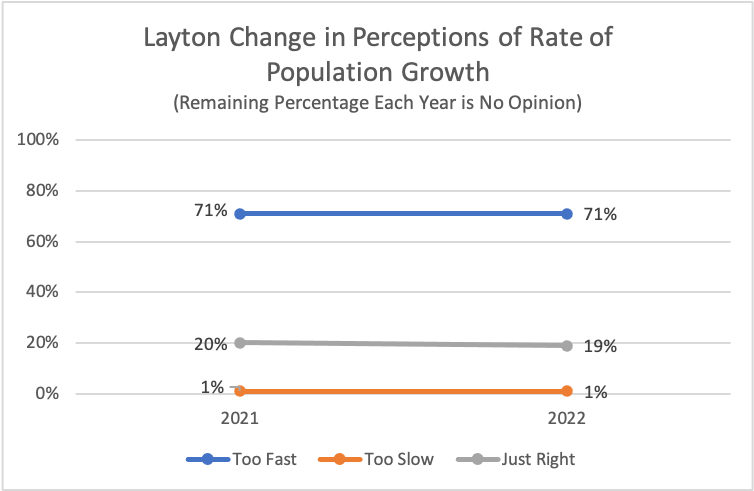
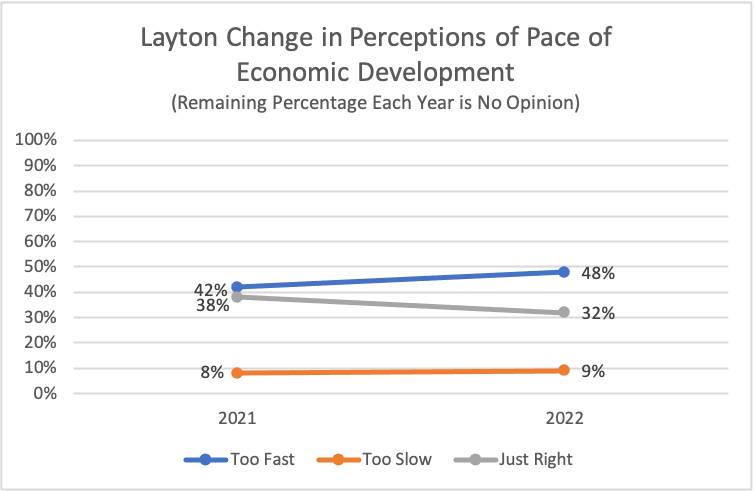
The graphs below show that perceptions on the current rate of population growth and pace of economic development in Layton did not change substantially between 2021 and 2022. The most notable difference was on the current pace of economic development, where the percent of those indicating it's too fast increased from 42% to 48% with a corresponding decline in those saying it's just right (from 38% to 32%).
The graphs below show how Layton compares to other participating cities in the Wellbeing Project on these perceptions of population growth and economic development in 2022. Margins of error are particularly high for Delta, Helper, Midvale, and Santaquin due to low survey response.
Concerns in Layton
Survey respondents indicated the degree to which a number of possible local issues were a concern as they look to the future of Layton. Water Supply, Air Quality, and Affordable Housing were the top three concerns with at least 80% of respondents indicating these were moderate or major concerns.
Other concerns were raised by 54 respondents who filled in the “other” category. Responses identical to the categories above are not included in the table.
Table 5
Other Concerns Mentioned |
|
|---|---|
| High density housing, overdevelopment (7) | Kids abusing public land |
| Noise pollution (6) | Government |
| Parks and recreation (6) | Parking |
| Green space, open space (5) | Emergency preparedness |
| Racial equality, diversity (4) | Walkability |
| Traffic (3) | Aggressive drivers |
| Economy (2) | Public transportation |
| City image (2) | Arts |
| Taxes (2) | Death |
| Library | |
Open Comments
Survey respondents were asked to comment on what they value most about Layton and to provide any additional comments about wellbeing. Comments have been shared with city leaders. In summary, residents of Layton valued the social climate, particularly the friendly neighbors, sense of community, and being near family. Residents of Layton also valued recreation, especially the trails and parks. Access to nature, the surrounding natural beauty, and sense of safety were also highly valued. In the additional comments section many residents had concerns regarding recreation, many wanting more trails, parks, and recreation centers. Growth and development was also a concern, with many wanting it to be limited. Many Layton residents also commented on poor road conditions and a lack of affordable housing.