San Juan County Wellbeing Survey Report
By Dr. Courtney Flint and Team
![]()
Contact Information
Dr. Courtney Flint
courtney.flint@usu.edu
435-797-8635
Summary
The Utah Wellbeing Survey project is designed to assess the wellbeing and local perspectives of city residents and to provide information to city leaders to inform their general planning processes. Over the years, we have found that each city and town has a unique experience and the Utah Wellbeing Survey allows for focused analysis at the community level. Survey questions include rating and importance of twelve different domains or categories of wellbeing, participation in recreation and nature-related activities, perspectives on local population growth and economic development, transportation perspectives, concerns for the future, and an array of demographic characteristic questions. Some cities added additional questions to their survey.
In early 2024, participating cities in San Juan County advertised the survey via social media, email lists, newsletters, and other ways of reaching out to local residents. All city residents age 18+ were encouraged to take the online Qualtrics survey.
What is in this report?
This report summarizes findings from the 2024 survey from three cities in San Juan County (Blanding, Bluff, and Monticello). Please see the individual city reports on the Utah Wellbeing Project website for more details. This information may help cities and other regional entities refine their messaging with residents on key issues, affirm existing plans, support future planning, and have practical implications for spending and providing services.
Utah League of Cities and Towns Cluster Classifications and Response Numbers
From San Juan County, 329 viable surveys were recorded in this 2024 survey effort. It should be noted that there were very few responses from Monticello and caution should be taken when interpreting these results.
This project benefits from the partnership with, and funding from, the Utah League of Cities and Towns, which is helping cities envision ways to use the findings from the wellbeing survey to inform their general planning processes. The Utah League of Cities and Towns clusters cities and towns into five different categories based on size and growth rates. We utilize these clusters in our analysis and have combined Rural Hub & Resort communities with Traditional Rural Communities. Some cities may fit within more than one cluster. The San Juan County cities with their cluster classification and number of responses are listed below:
Rural Hub & Resort, Traditional Rural Communities
Blanding (236)
Bluff (65)
Monticello (28)
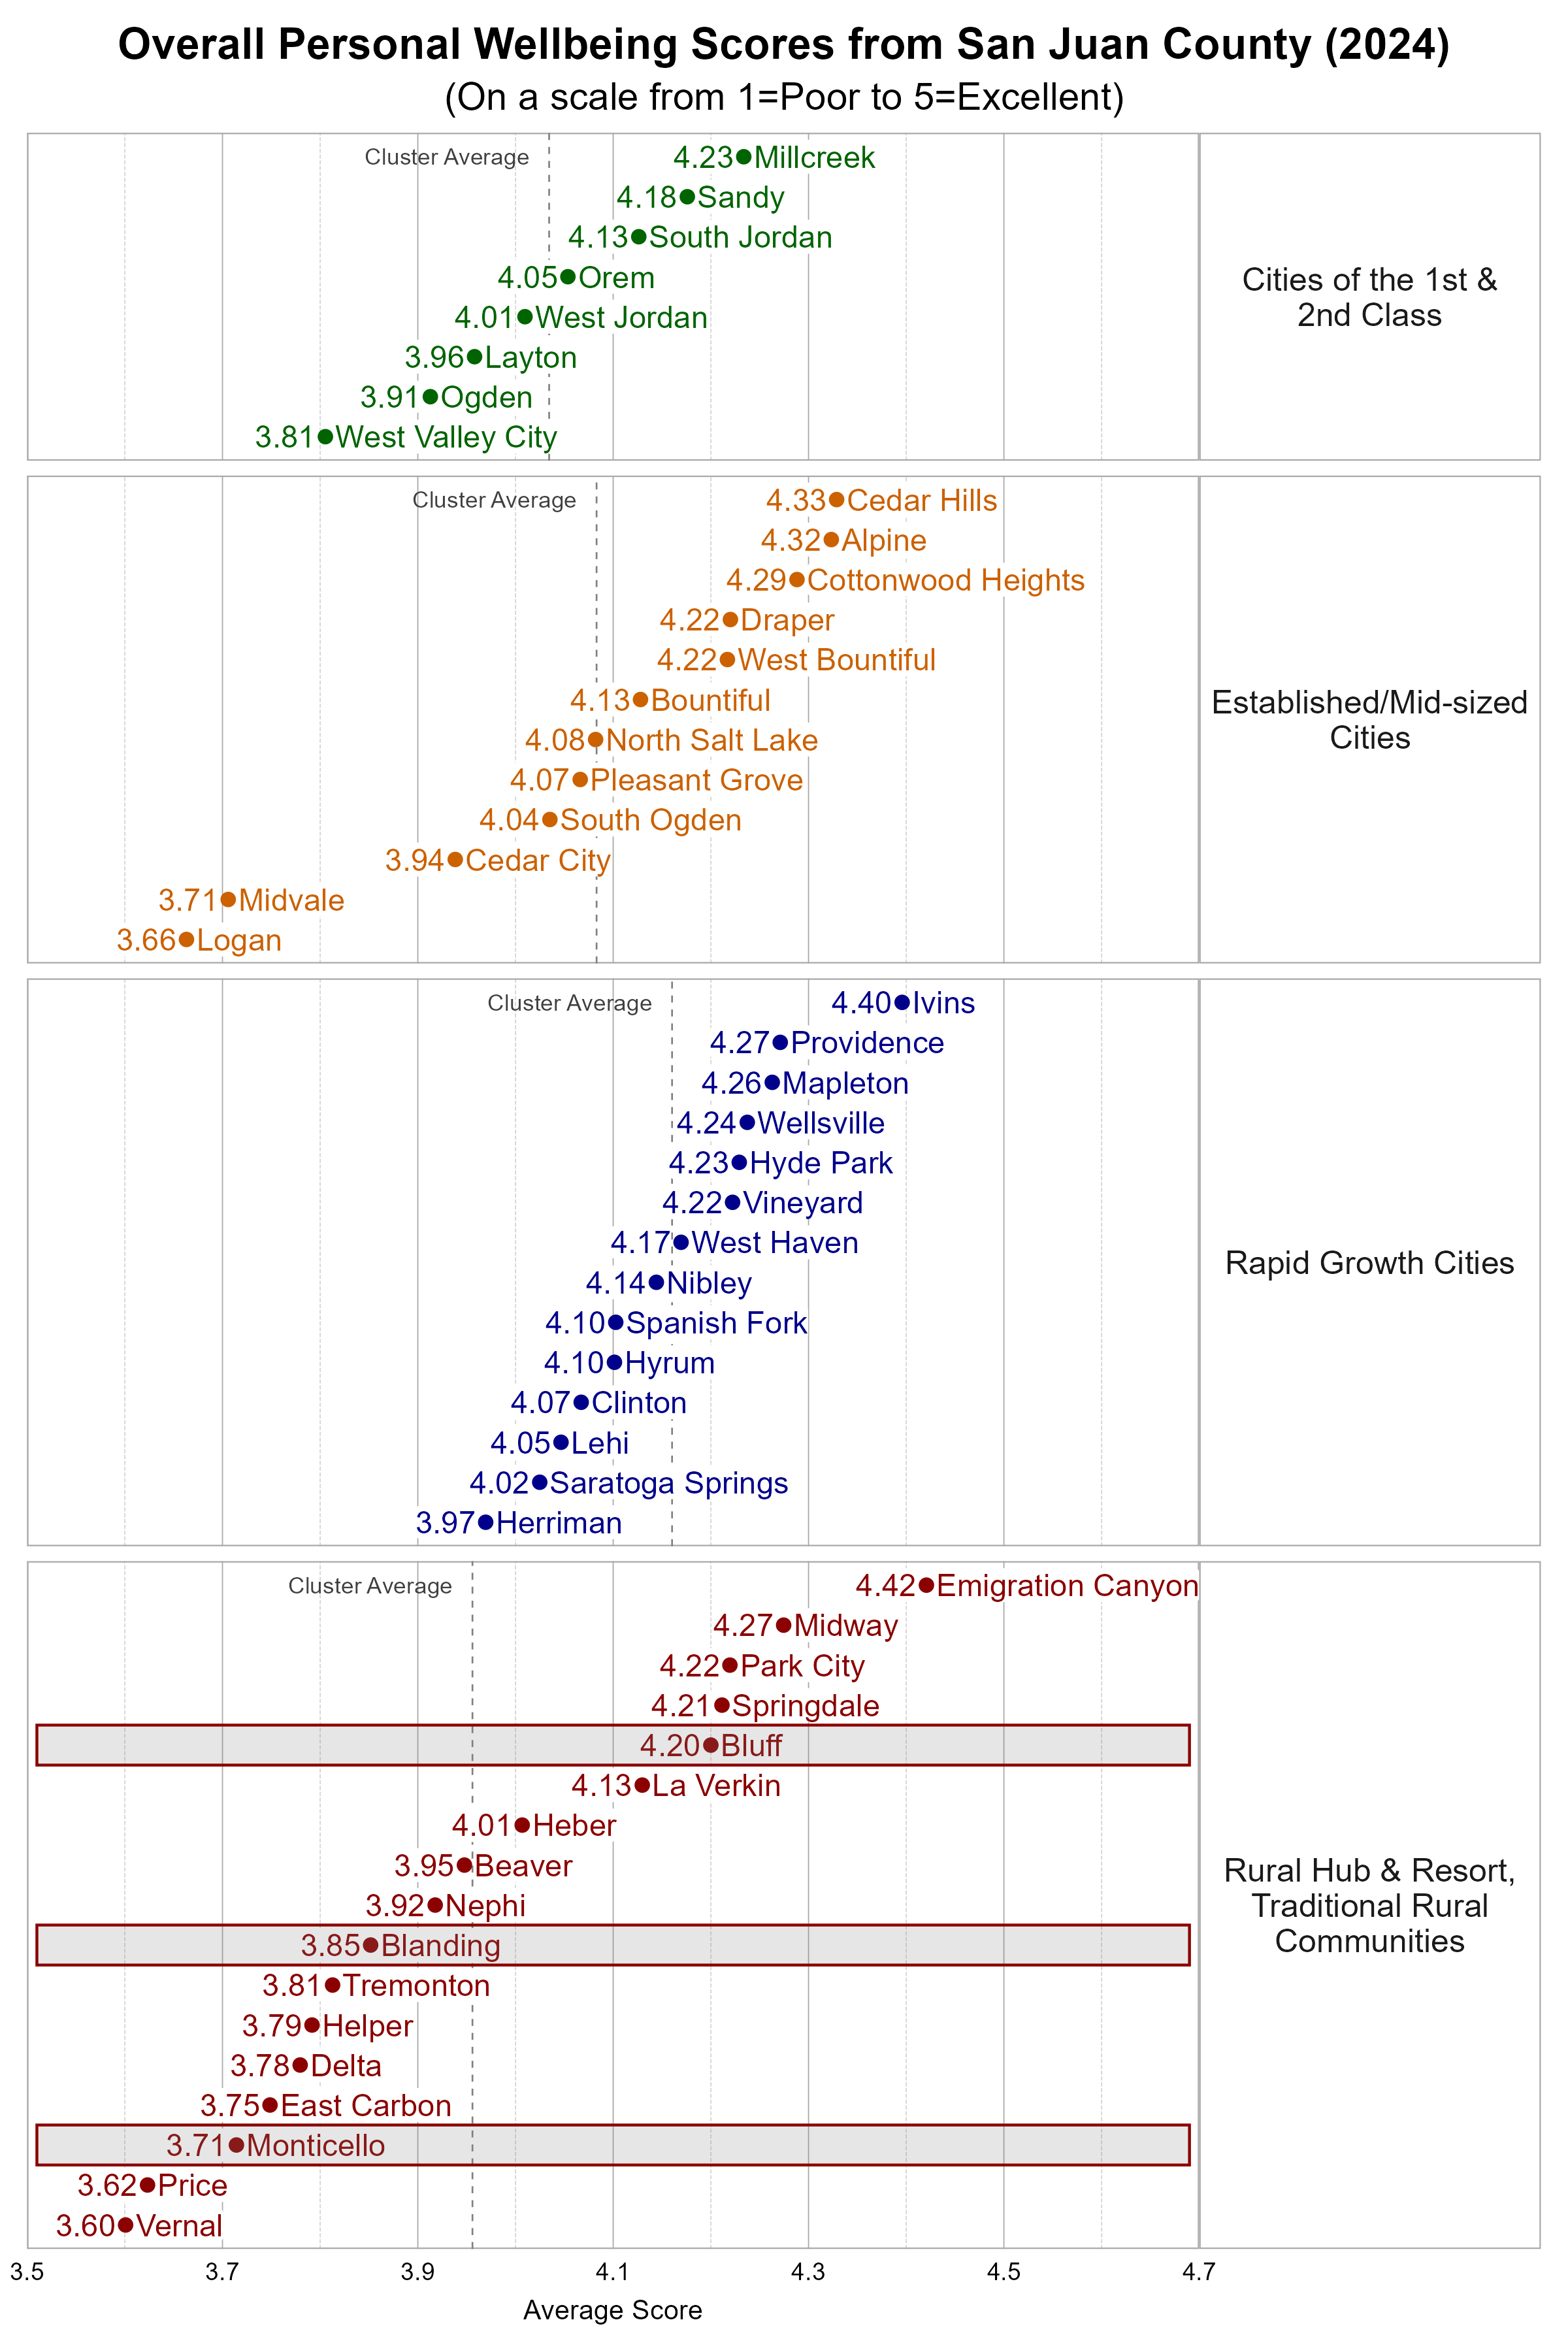
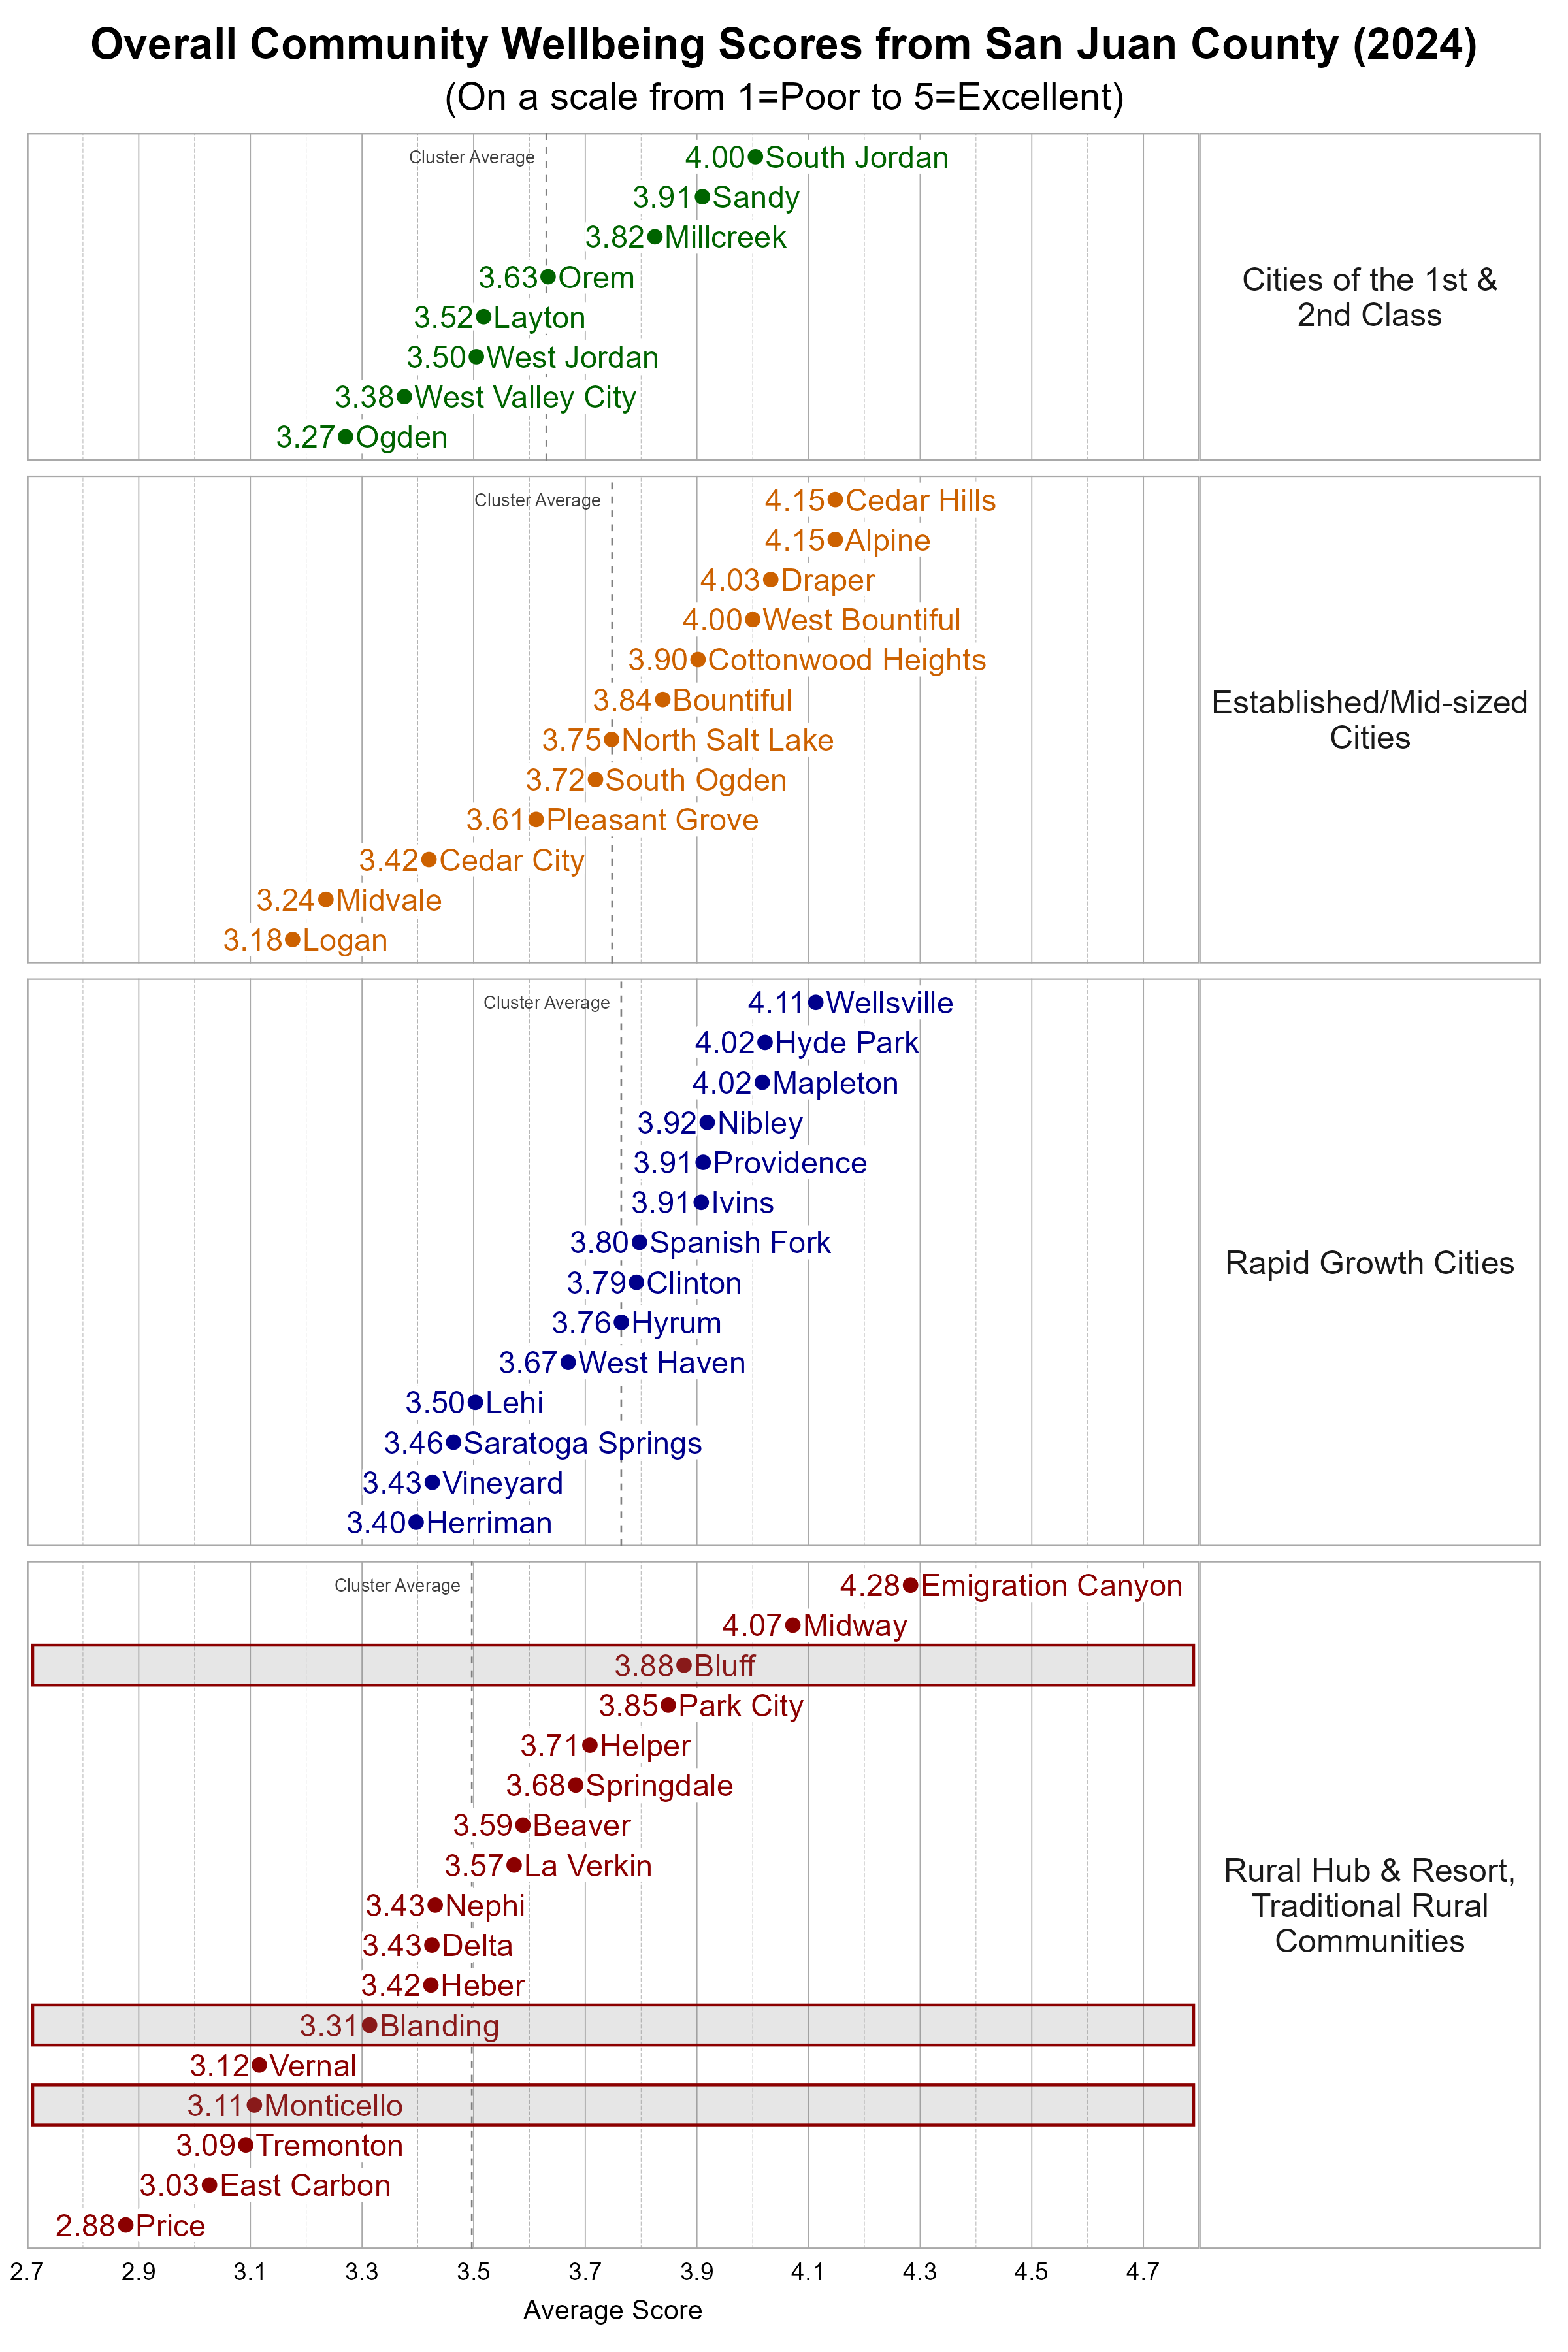
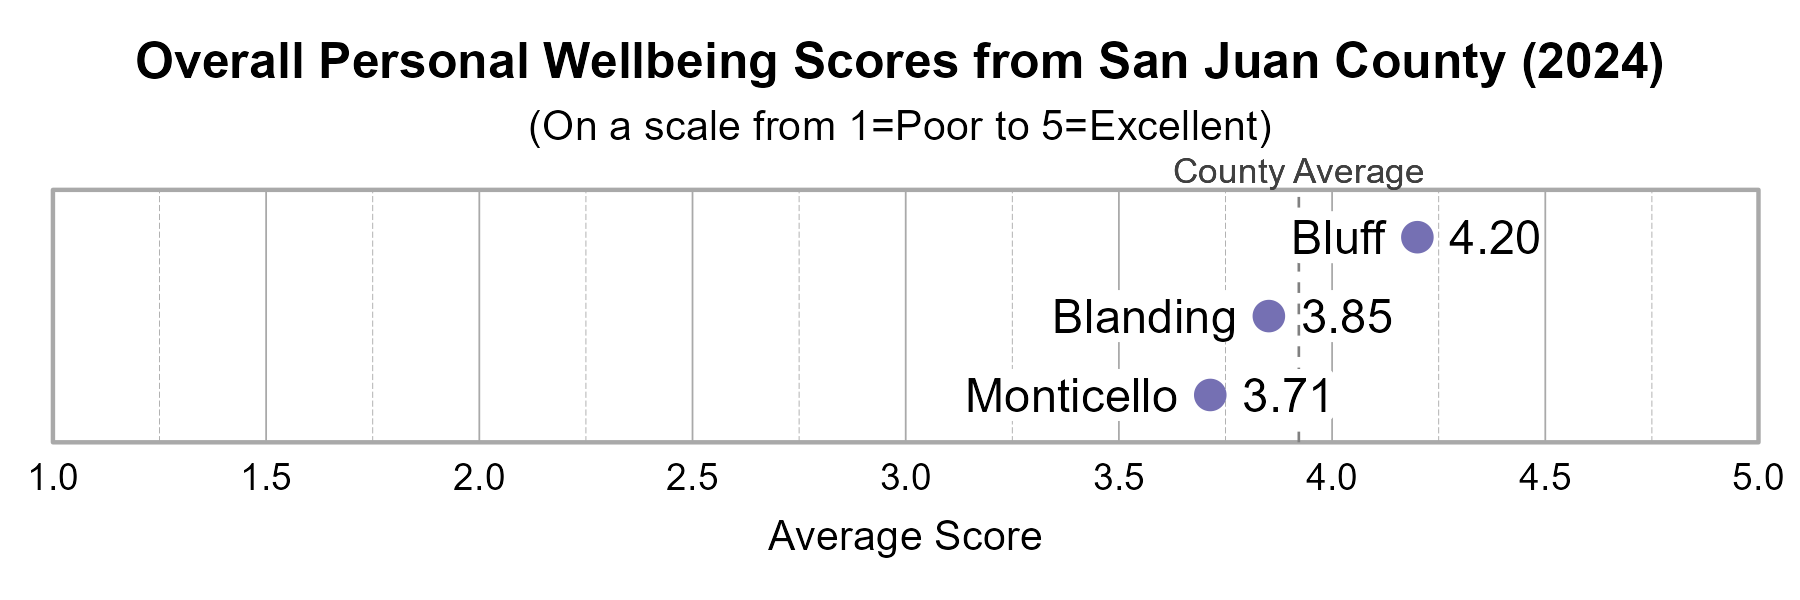
Overall Personal Wellbeing and Community Wellbeing
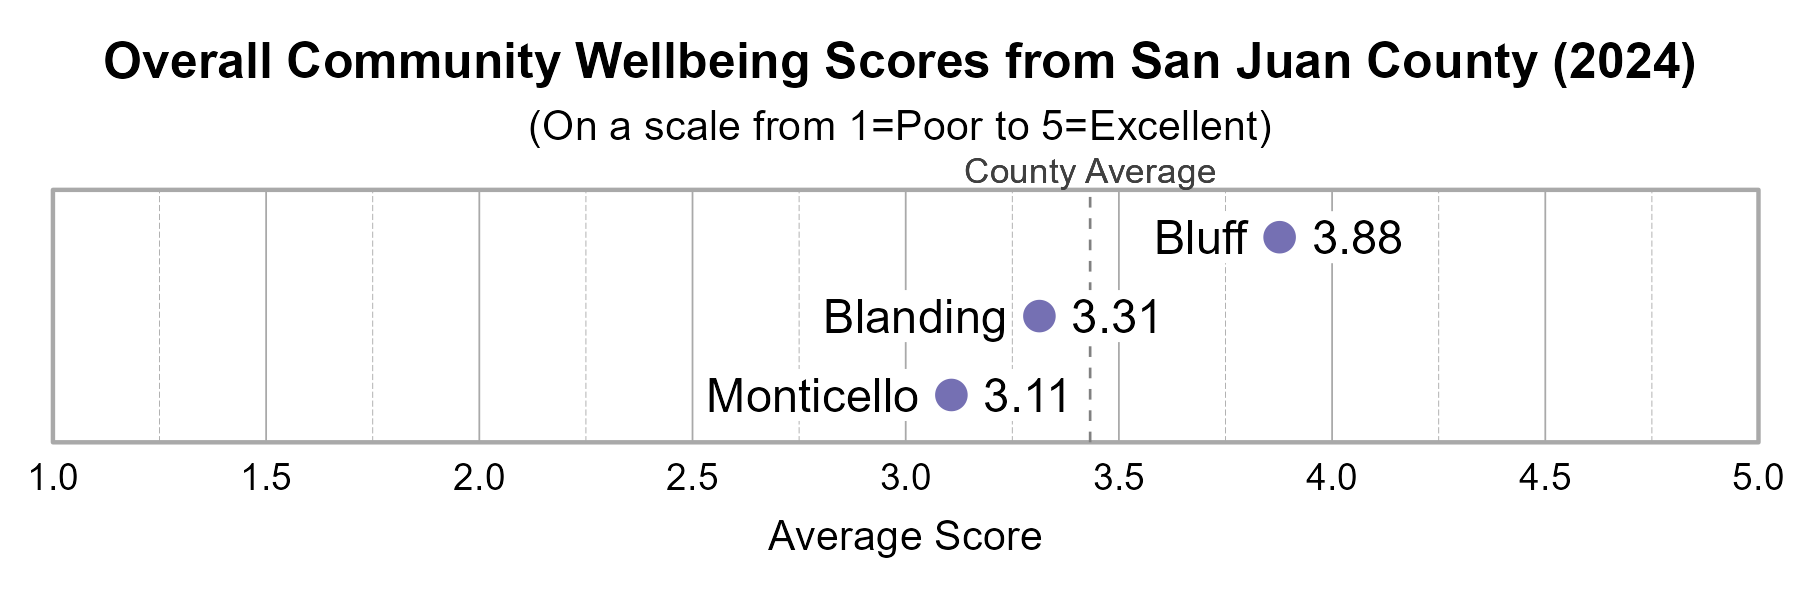
Survey participants were asked about their overall personal wellbeing and overall community wellbeing in their respective cities or towns. The San Juan County cities are highlighted in the graph below. wellbeing indicators were both measured on a 5-point scale from poor (1) to excellent (5). The average of the city average personal wellbeing scores in San Juan County was 3.92 with 74% of respondents indicating their wellbeing at a 4 or 5 on the 5-point scale. The average of the city average scores for community wellbeing in San Juan County was 3.43 with 50% of respondents indicating community wellbeing at a 4 or 5 on the 5-point scale. As the graphs below show, scores vary across the three participating cities.
Wellbeing Domains
According to national and international entities that track wellbeing, there are a number of common dimensions or domains of wellbeing. Survey respondents rated twelve domains on a 5-point scale from poor to excellent. They were also asked to indicate the importance of each domain to their overall personal wellbeing on a 5-point scale from not at all important to very important.
The highest rated wellbeing domains for the three San Juan County study cities were:
- Connection with Nature (all 3 cities)
- Safety and Security (all 3 cities)
- Family Life (Blanding)
- Local Environmental Quality (Bluff)
- Physical Health (Monticello)
The most important wellbeing domains for the three San Juan County study cities were:
- Mental Health (all 3 cities)
- Physical Health (Bluff, Monticello)
- Safety and Security (Blanding, Monticello)
- Connection with Nature (Bluff)
- Family Life (Blanding)
- Leisure Time (Monticello)
- Local Environmental Quality (Bluff)
The “Red Zone” Domains (higher importance, lower quality) for the three San Juan County study cities were:
- Blanding — Living Standards, Physical Health
- Monticello — Leisure Time, Living Standards
Community Connection
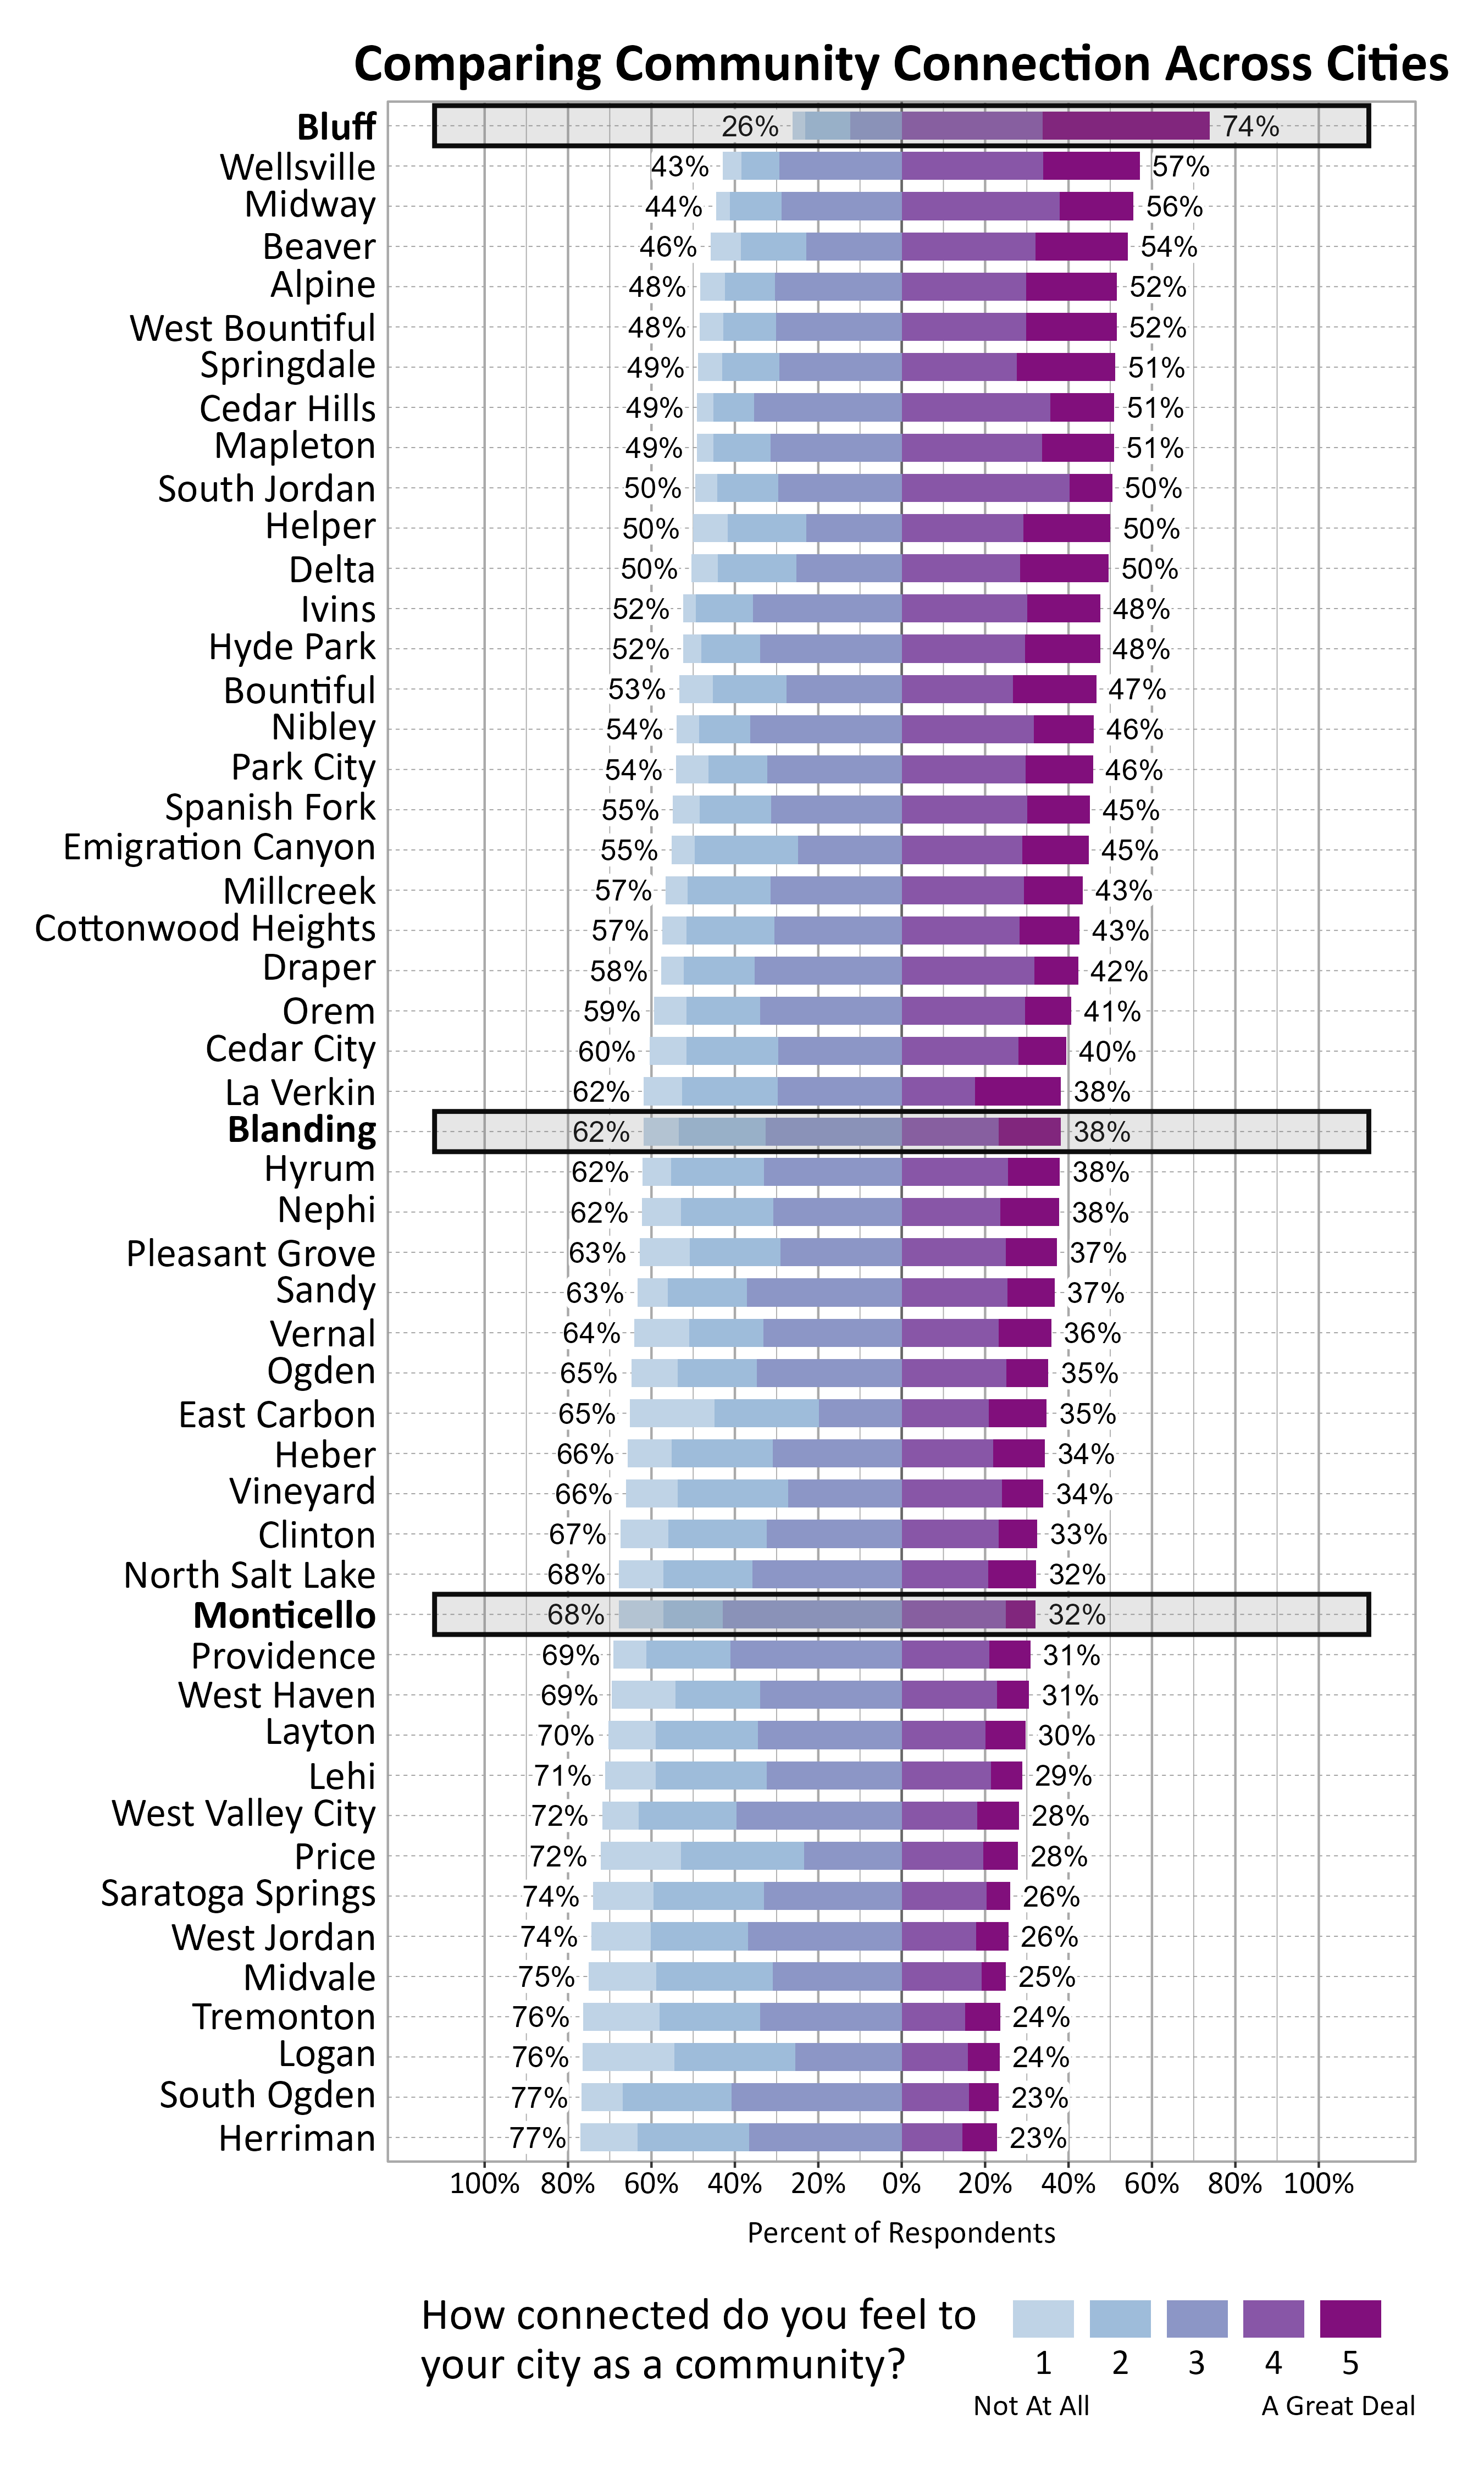
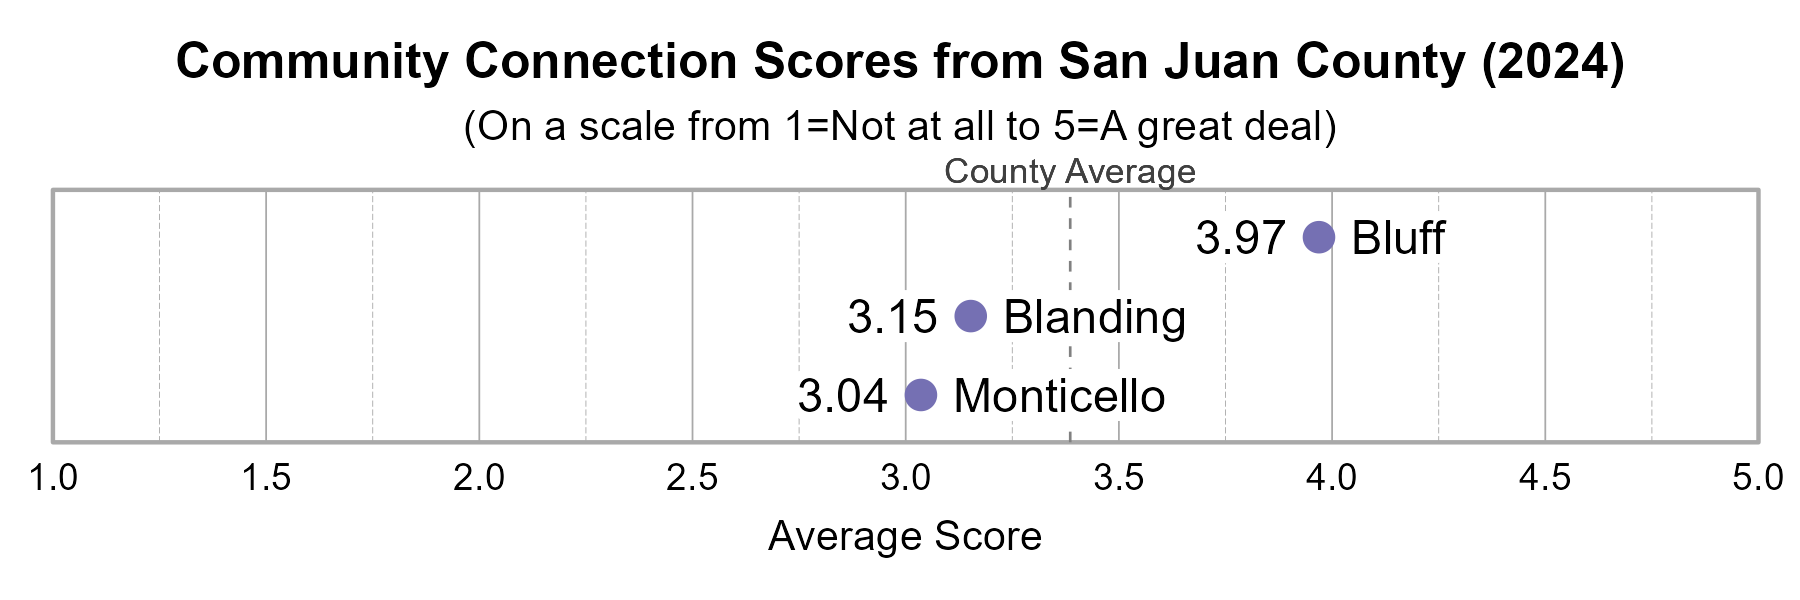
Survey participants were asked about how connected they feel to their city on a 5-point scale from not at all (1) to a great deal (5). Community Connection was highest for Bluff and lowest for Monticello.
Participation in Recreation and Nature-Related Activities
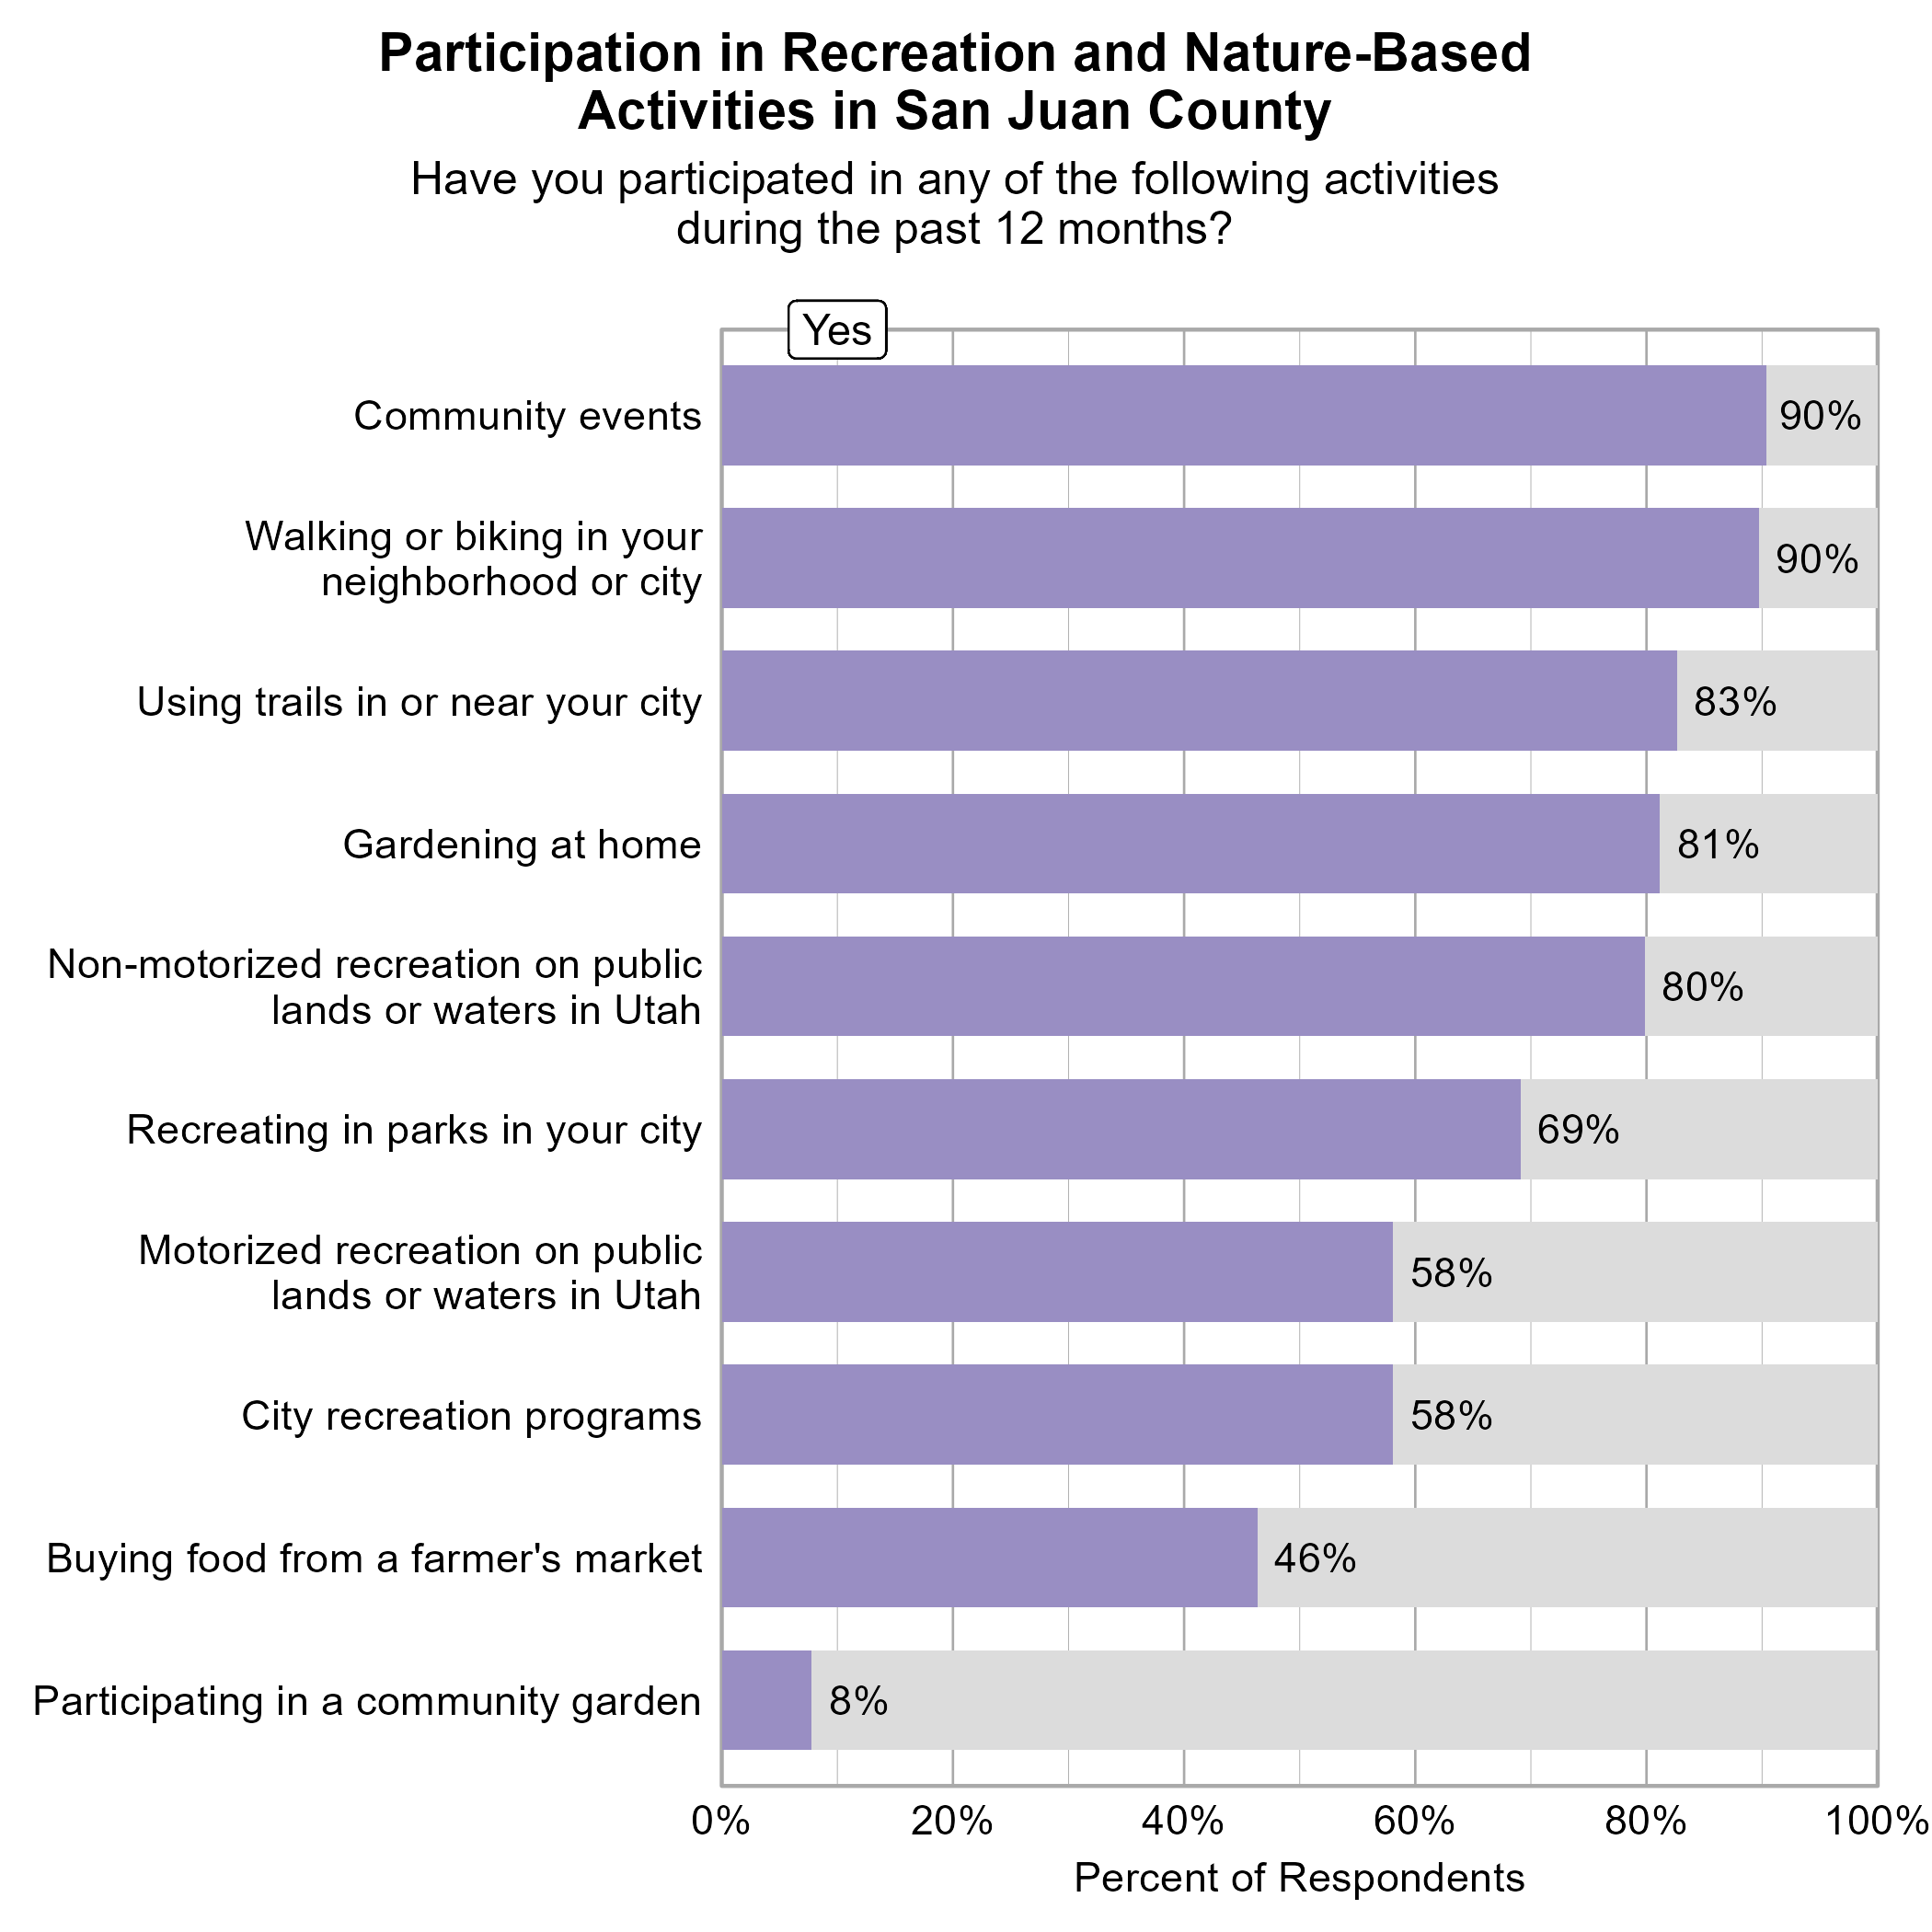
Respondents were asked to indicate whether or not they participated in various activities in the last 12 months. The most popular activities in San Juan County were community events (90%), walking or biking in your neighborhood or city (90%), using trails in or near your city (83%), and gardening at home (81%).
Activities for each city that were found to be significantly correlated with higher levels of wellbeing, community connection, mental health or physical health are shown below in the table. Due to low response numbers, no statistical tests were able to be performed for Monticello.
| Personal Wellbeing | Community Wellbeing | Community Connection | Mental Health | Physical Health | |
|---|---|---|---|---|---|
| Blanding |
|
|
|
|
|
| Bluff |
|
||||
| Monticello |
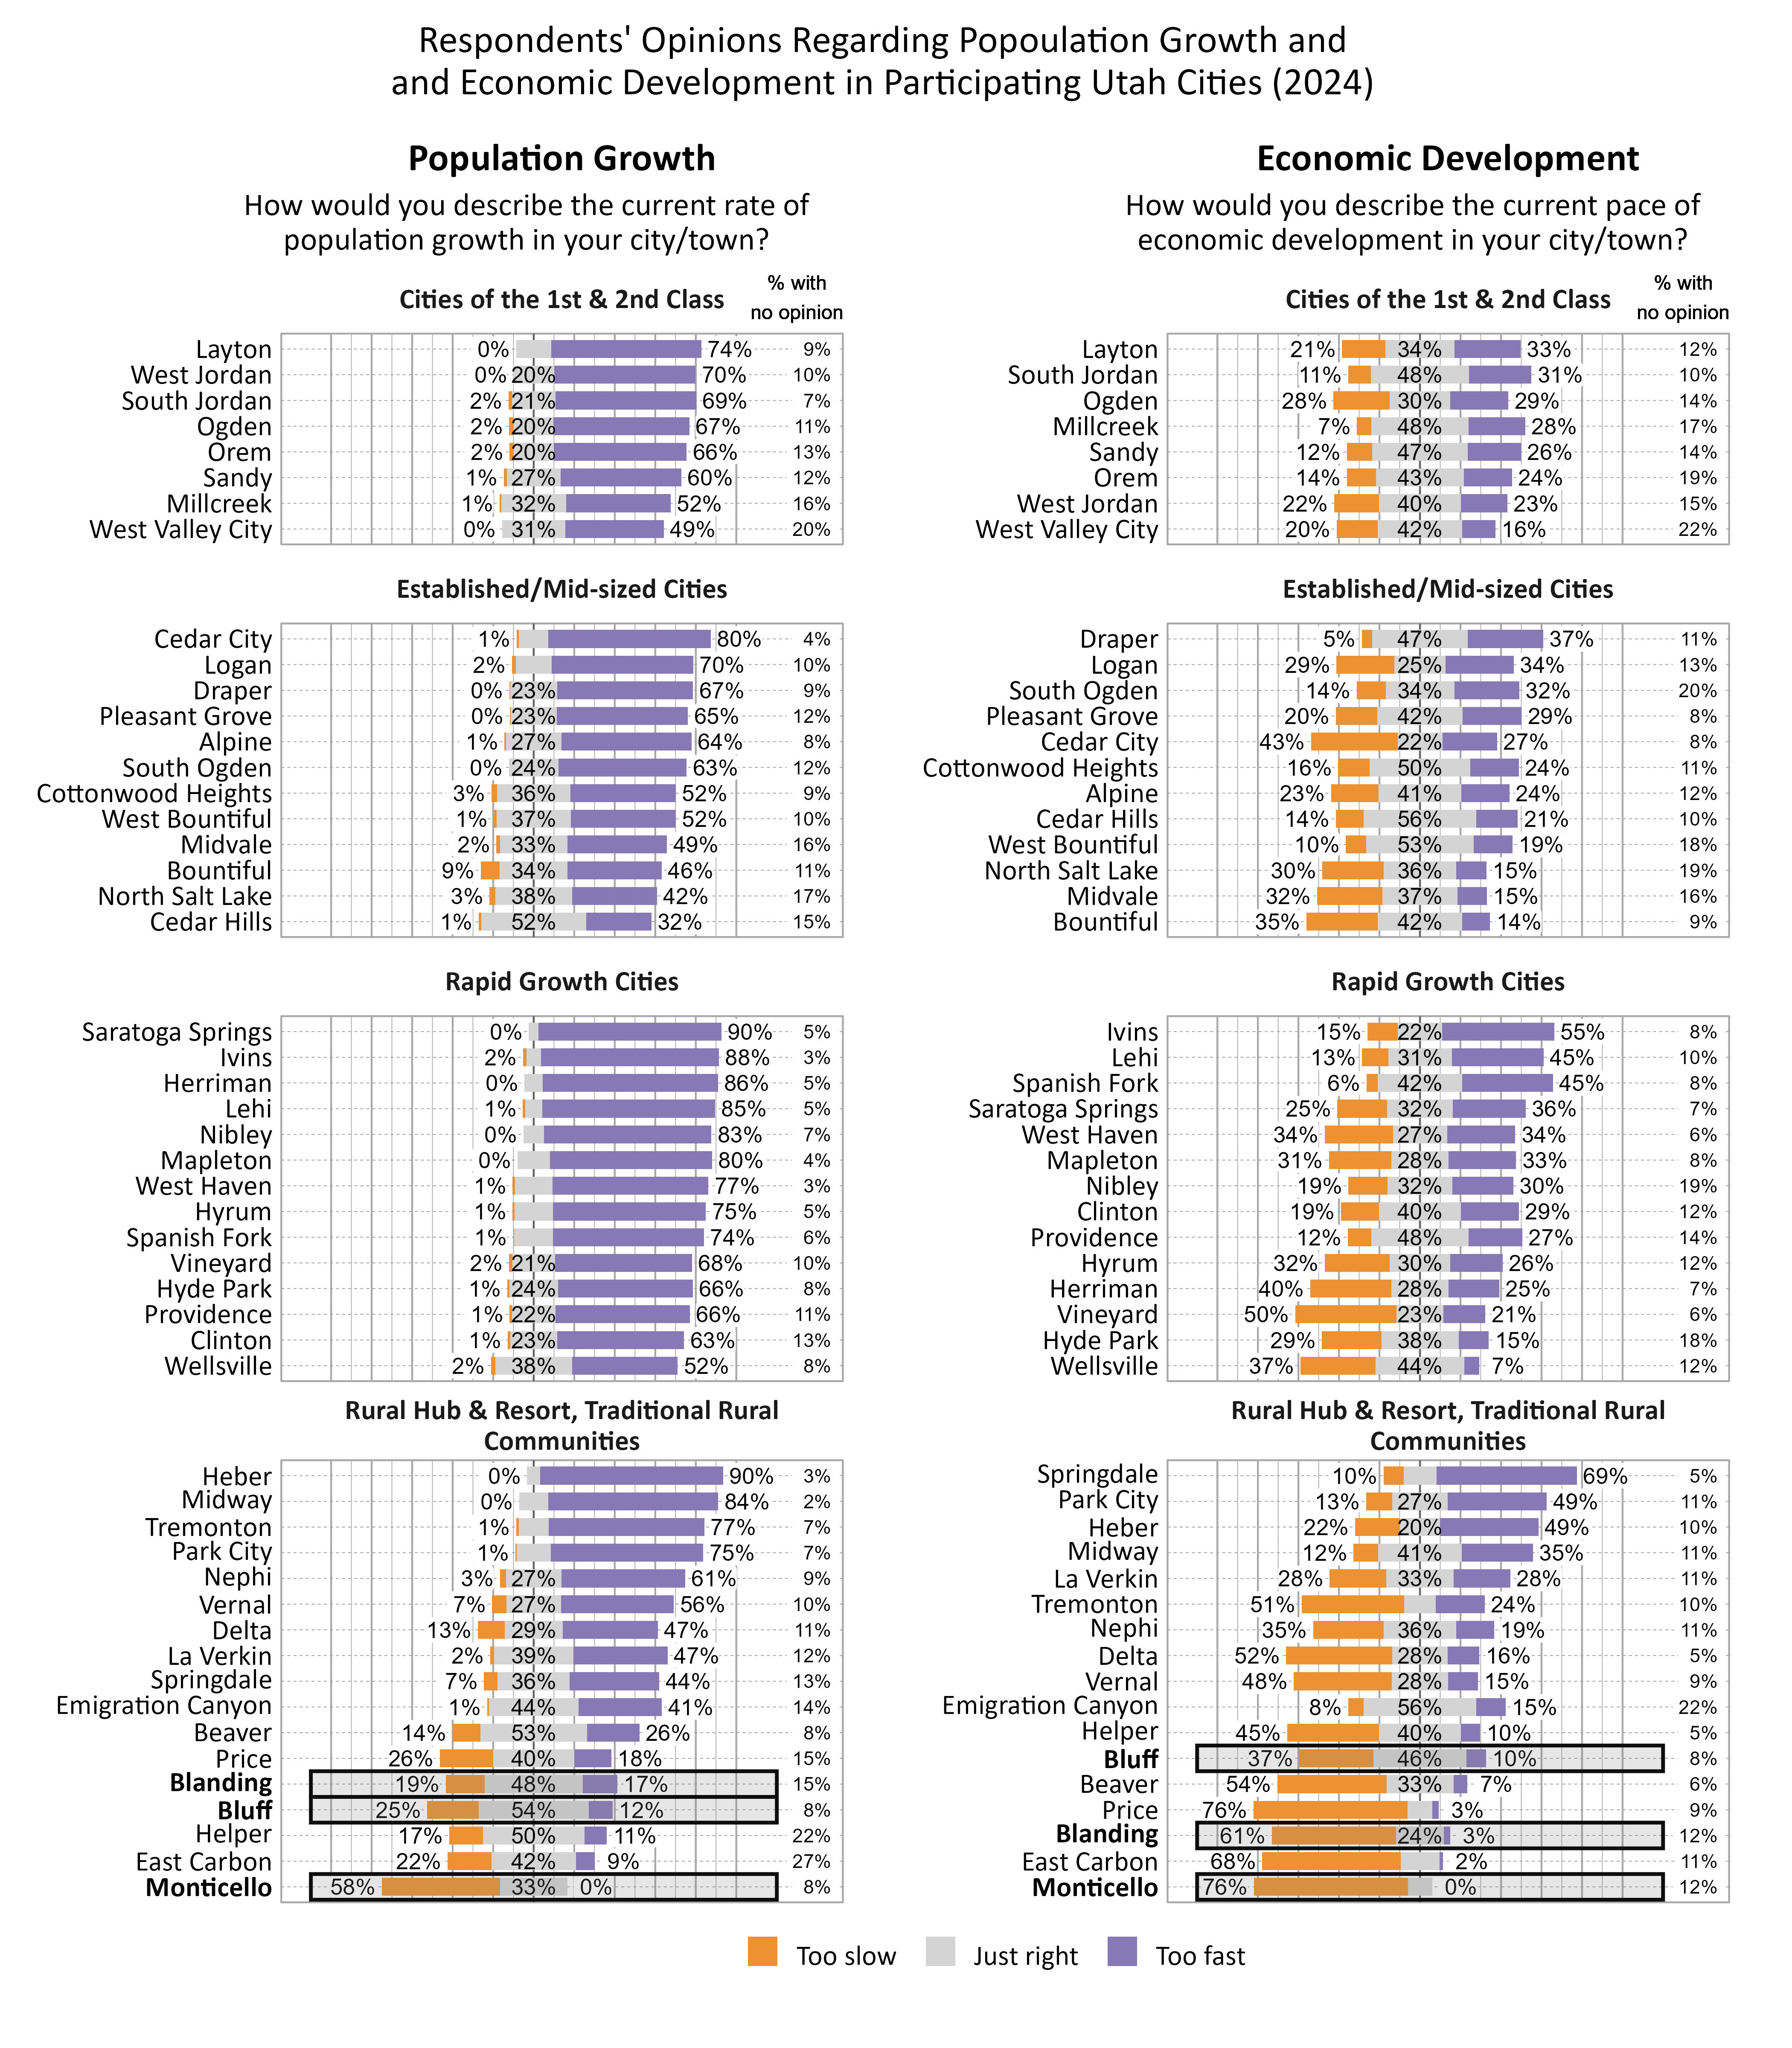
Perspectives on Population Growth and Economic Development
The largest proportion of respondents felt the Rate of Population Growth was too slow in Monticello and just right in Bluff and Blanding.
The largest proportion of respondents felt the Pace of Economic Growth was too slow in Monticello and Blanding and just right in Bluff.
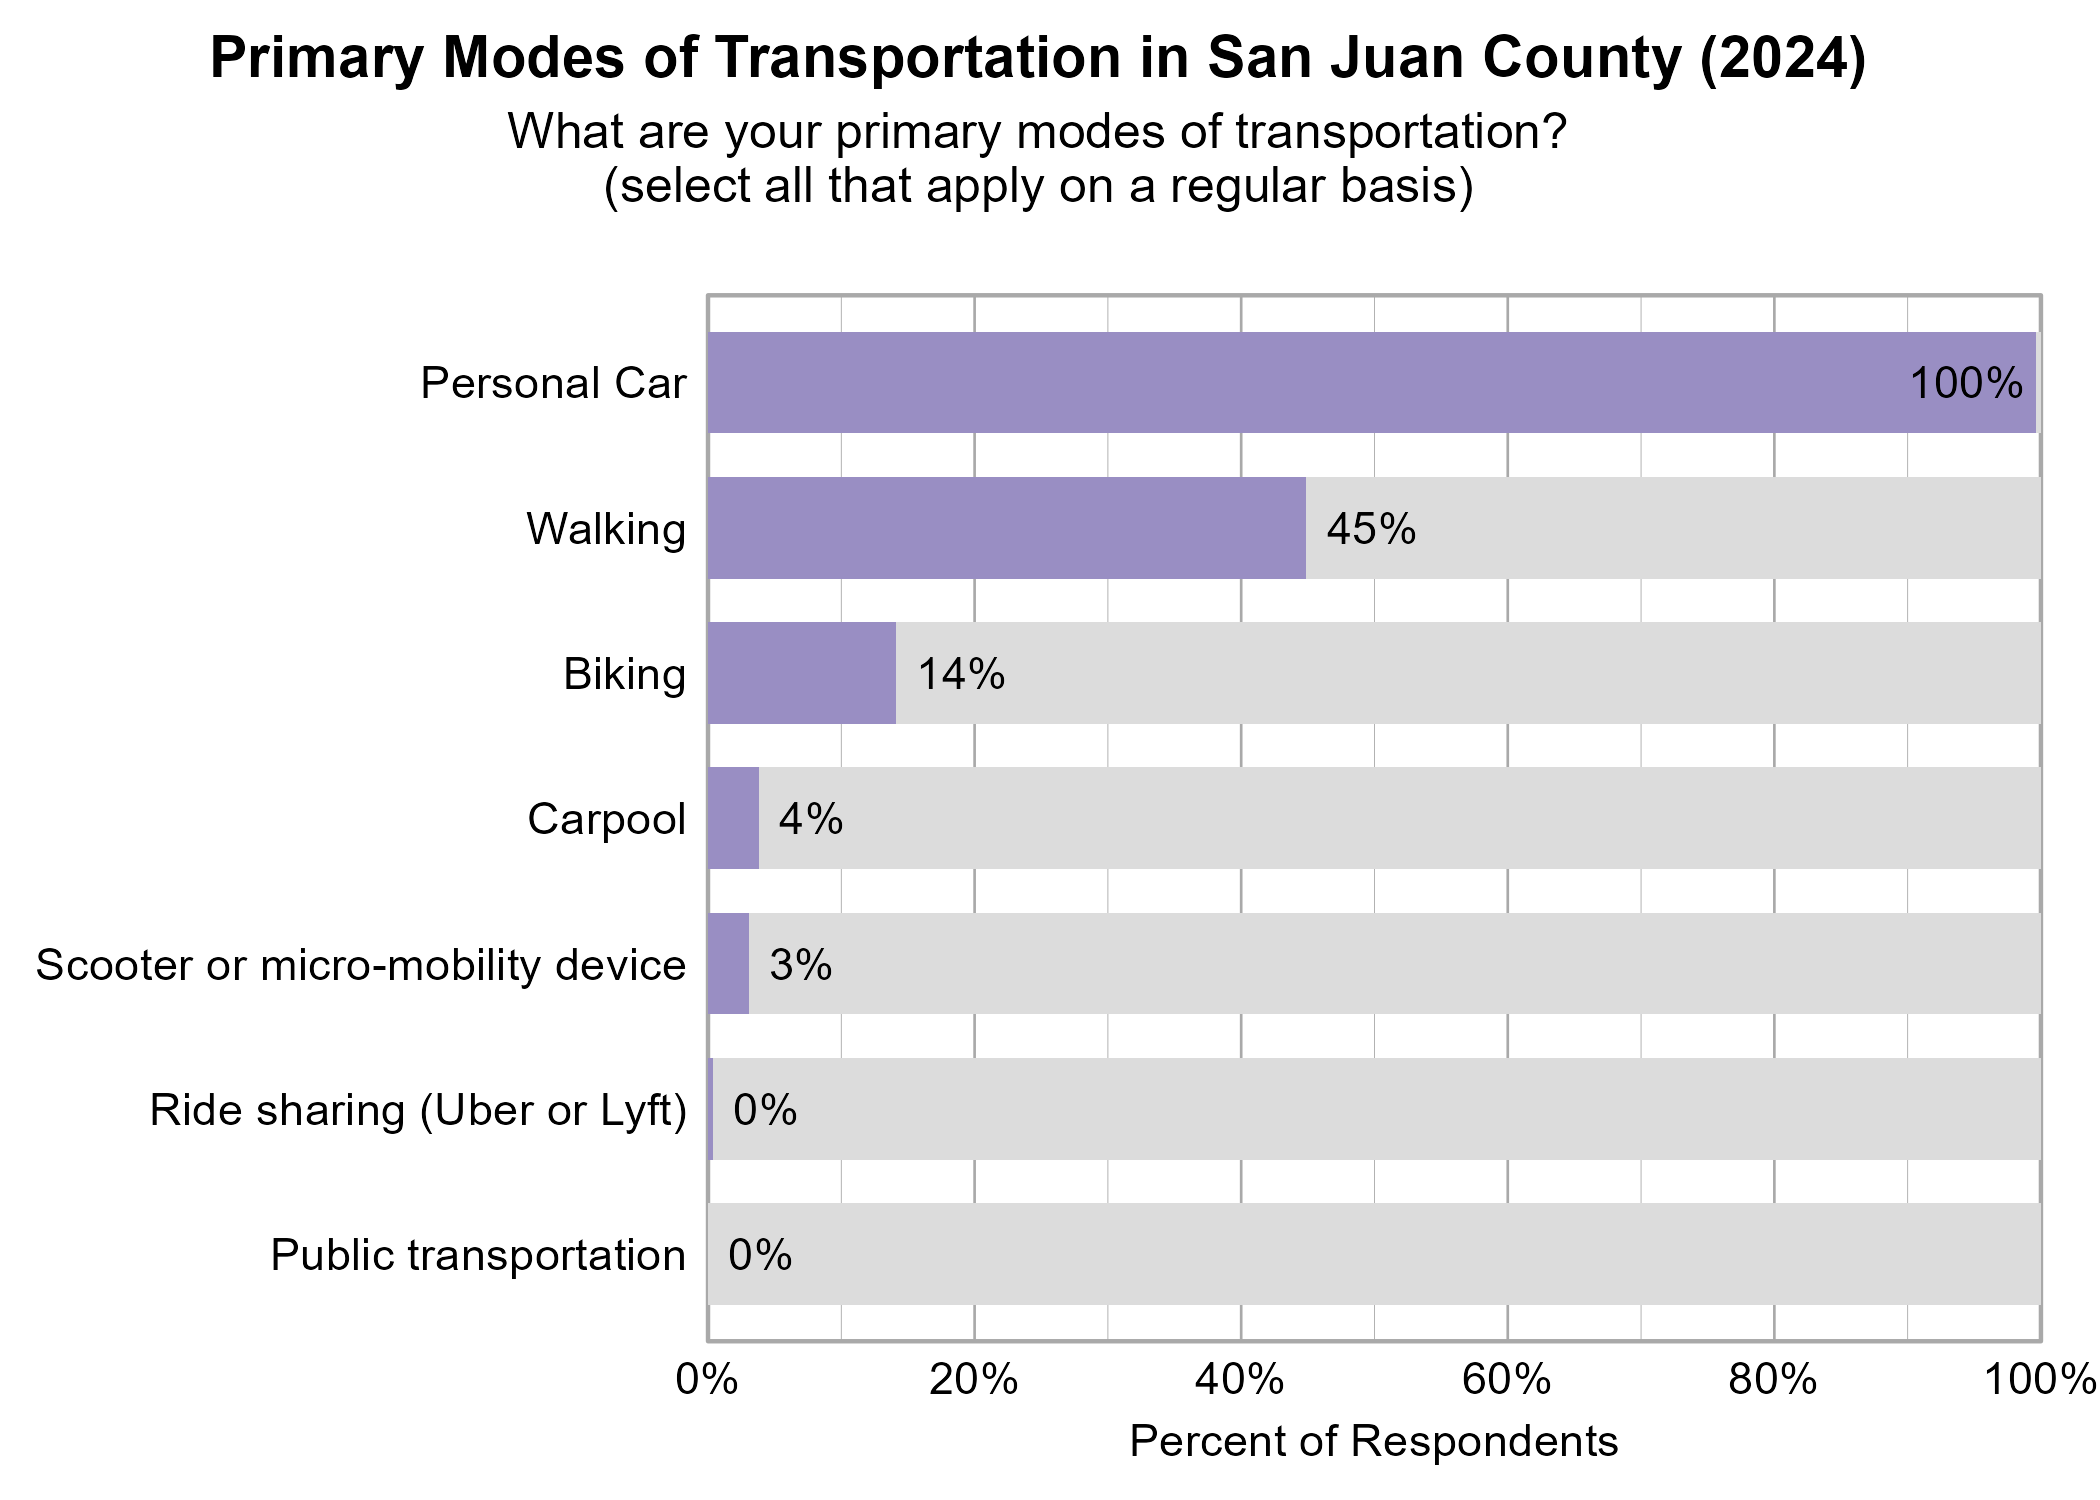
Transportation in San Juan County
Respondents were asked to indicate all of their primary modes of transportation on a regular basis in their city. The most popular modes of transportation across San Juan County were personal car (100%) and walking (45%).
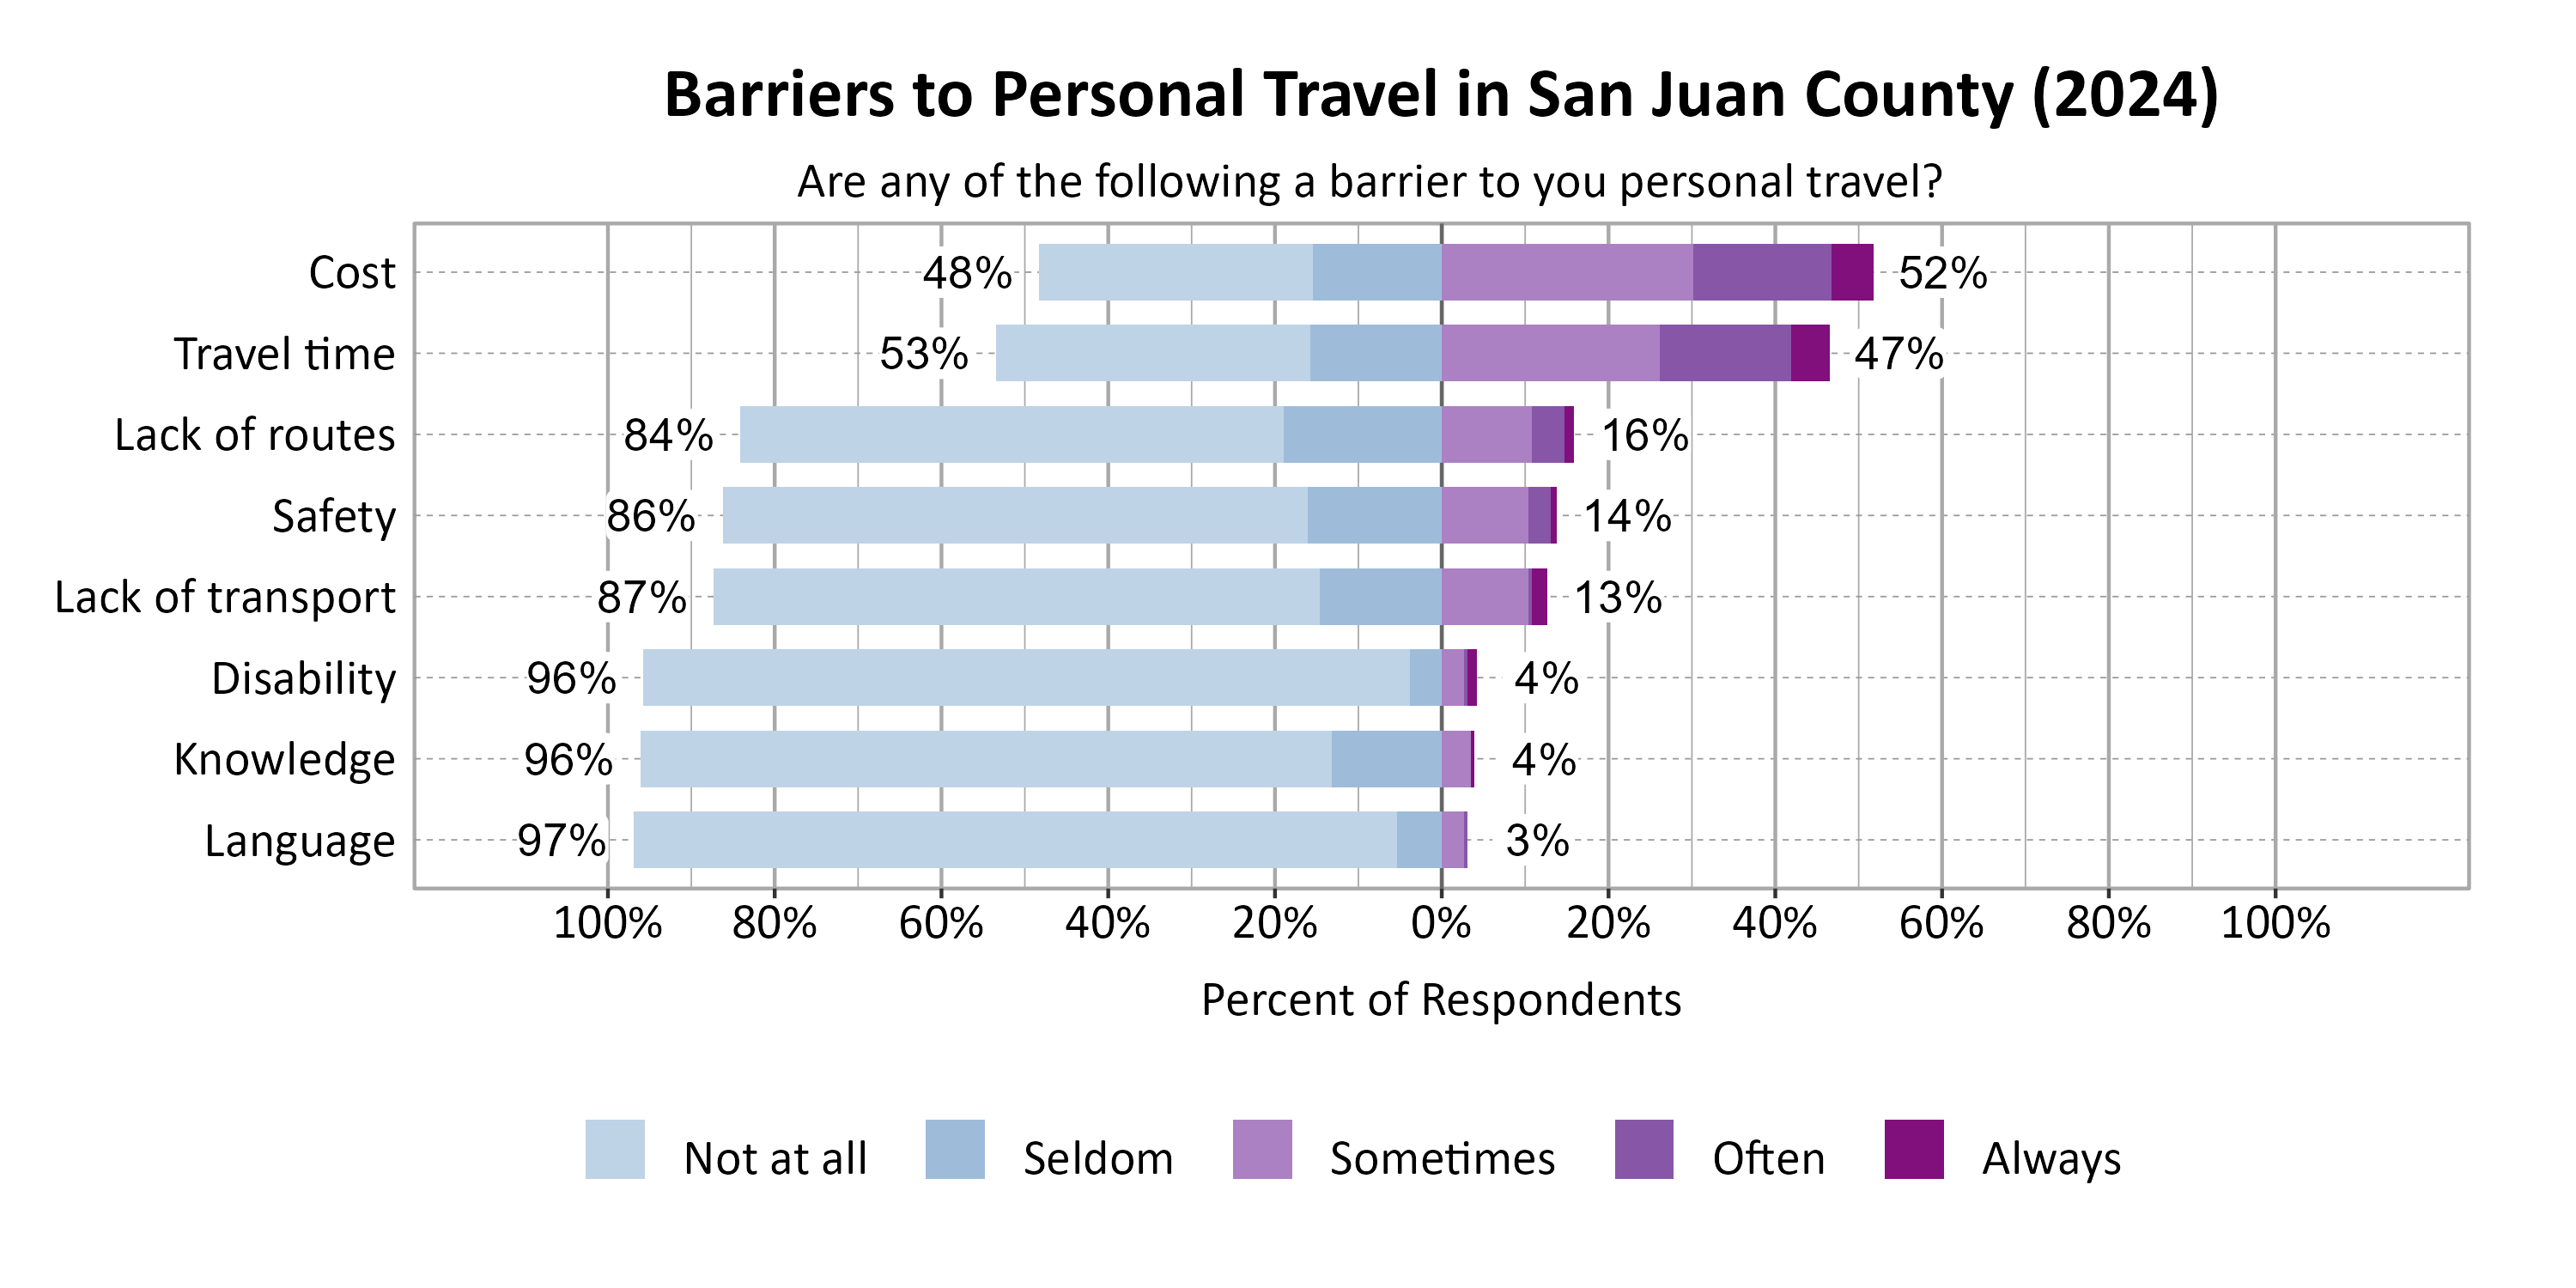
Respondents were asked to indicate the most common barriers to transportation in their city. The most problematic barriers across San Juan County were Cost (52%) and Travel time (47%).
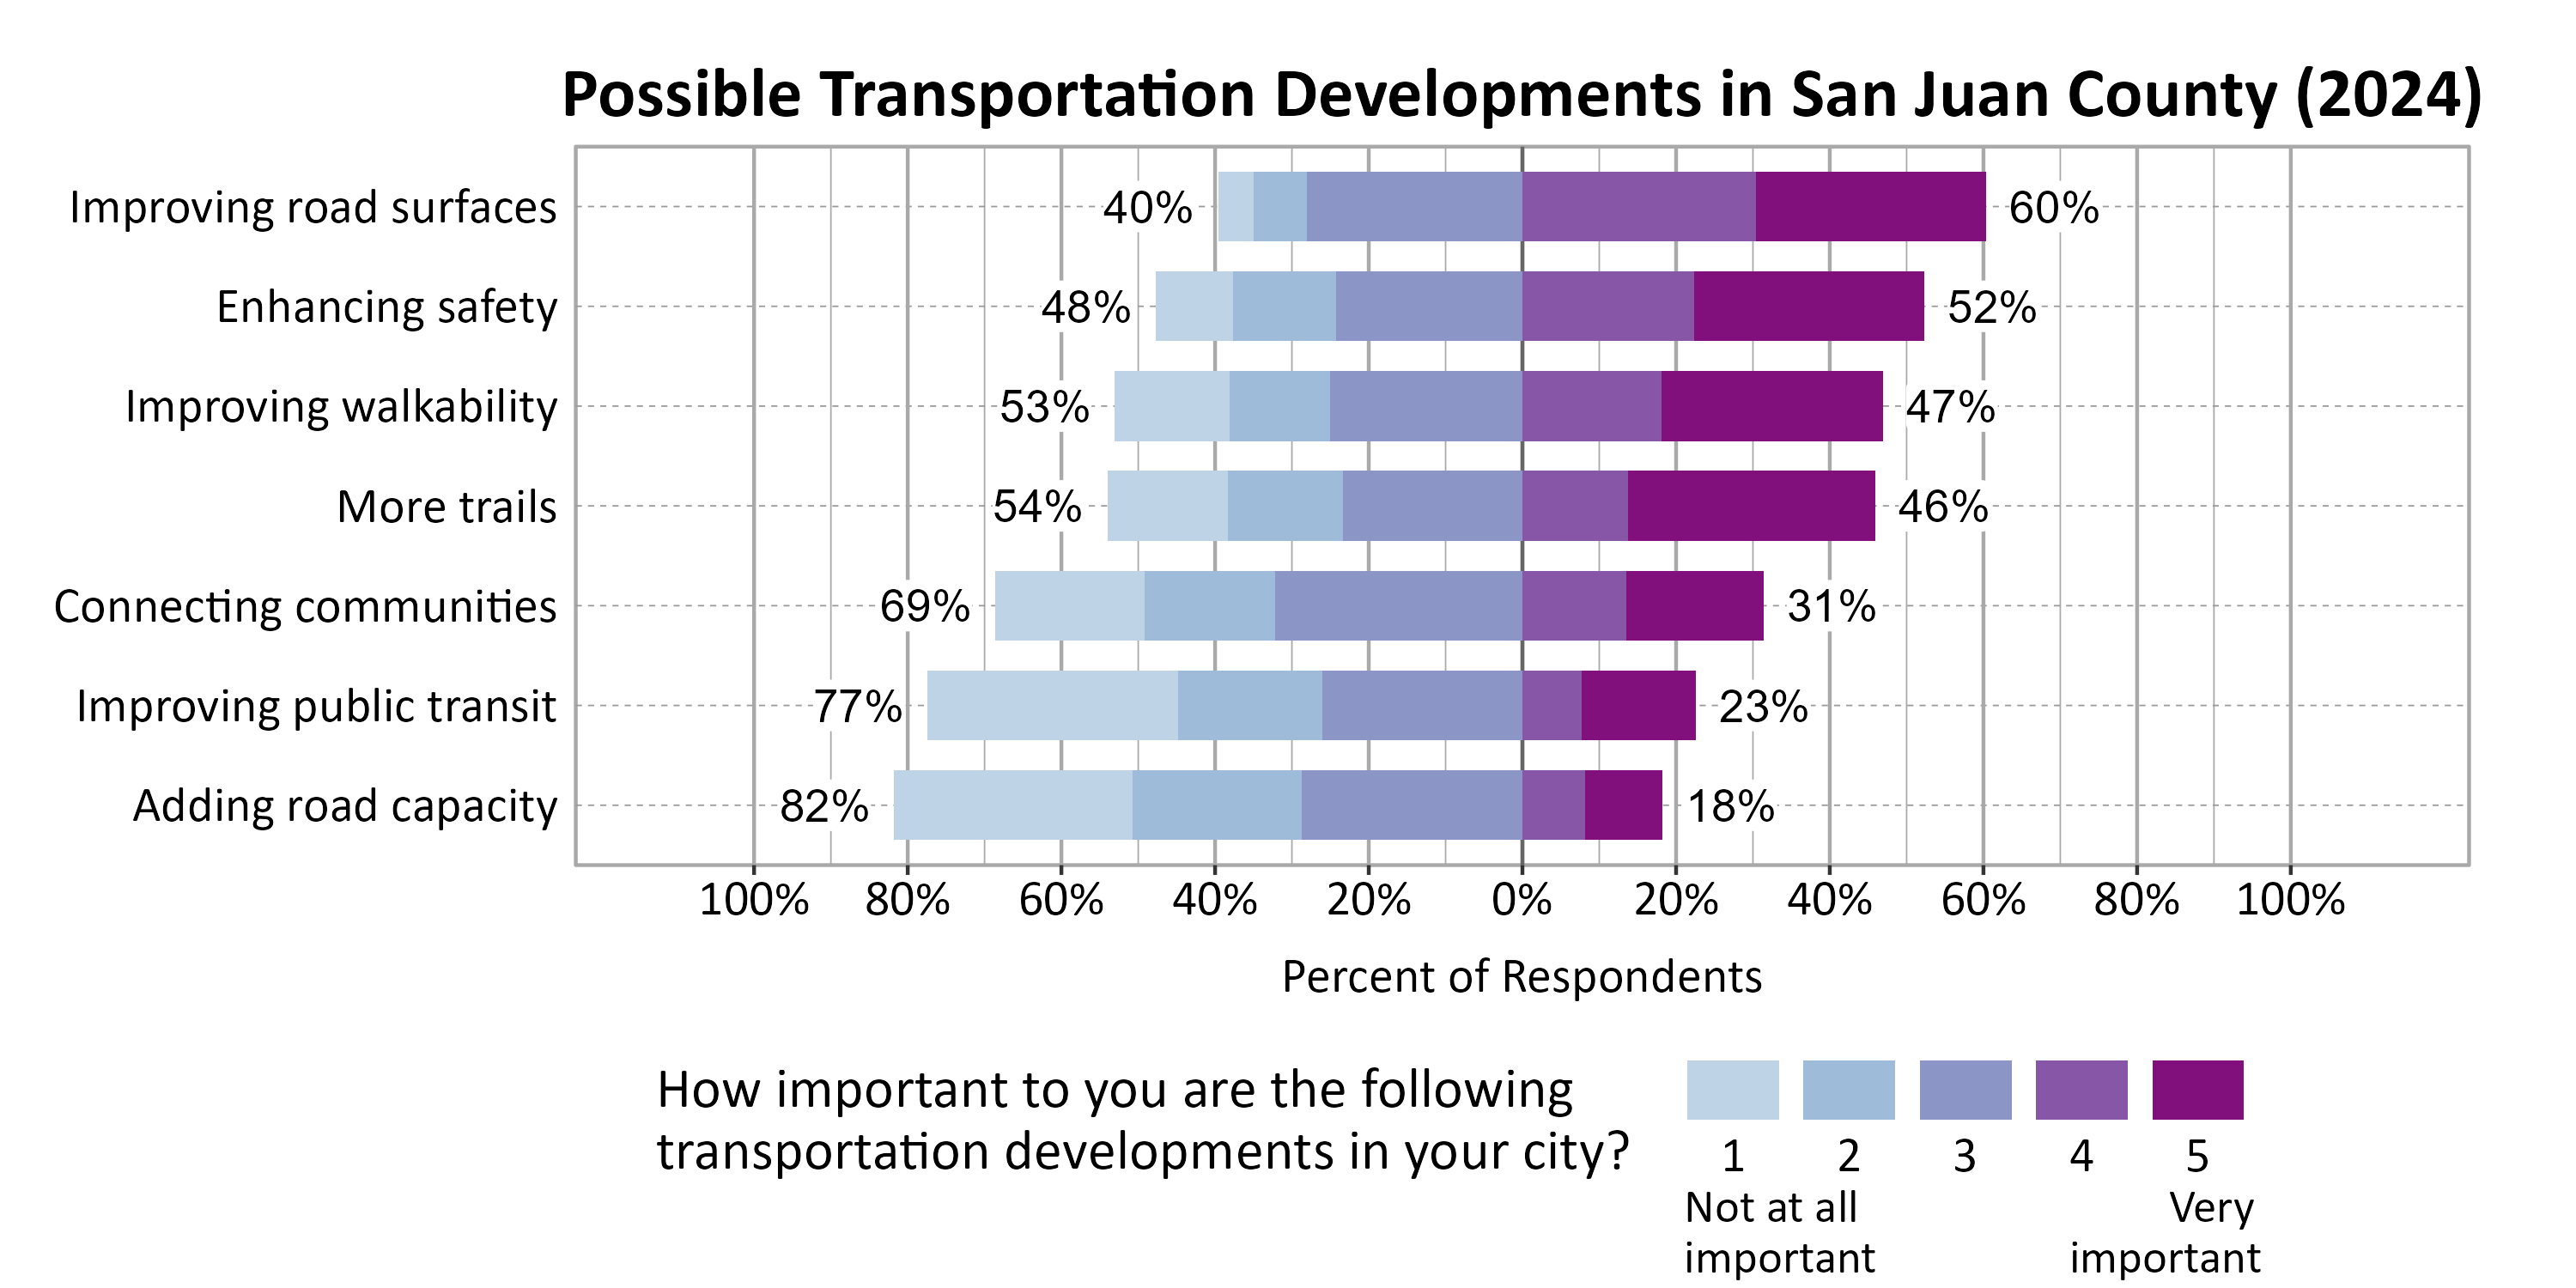
Respondents were asked to indicate the importance of a set of possible transportation developments in their city. The most important developments to respondents in San Juan County were Improving road surfaces (60%), Enhancing safety (52%), Improving walkability (47%), and More trails (46%).
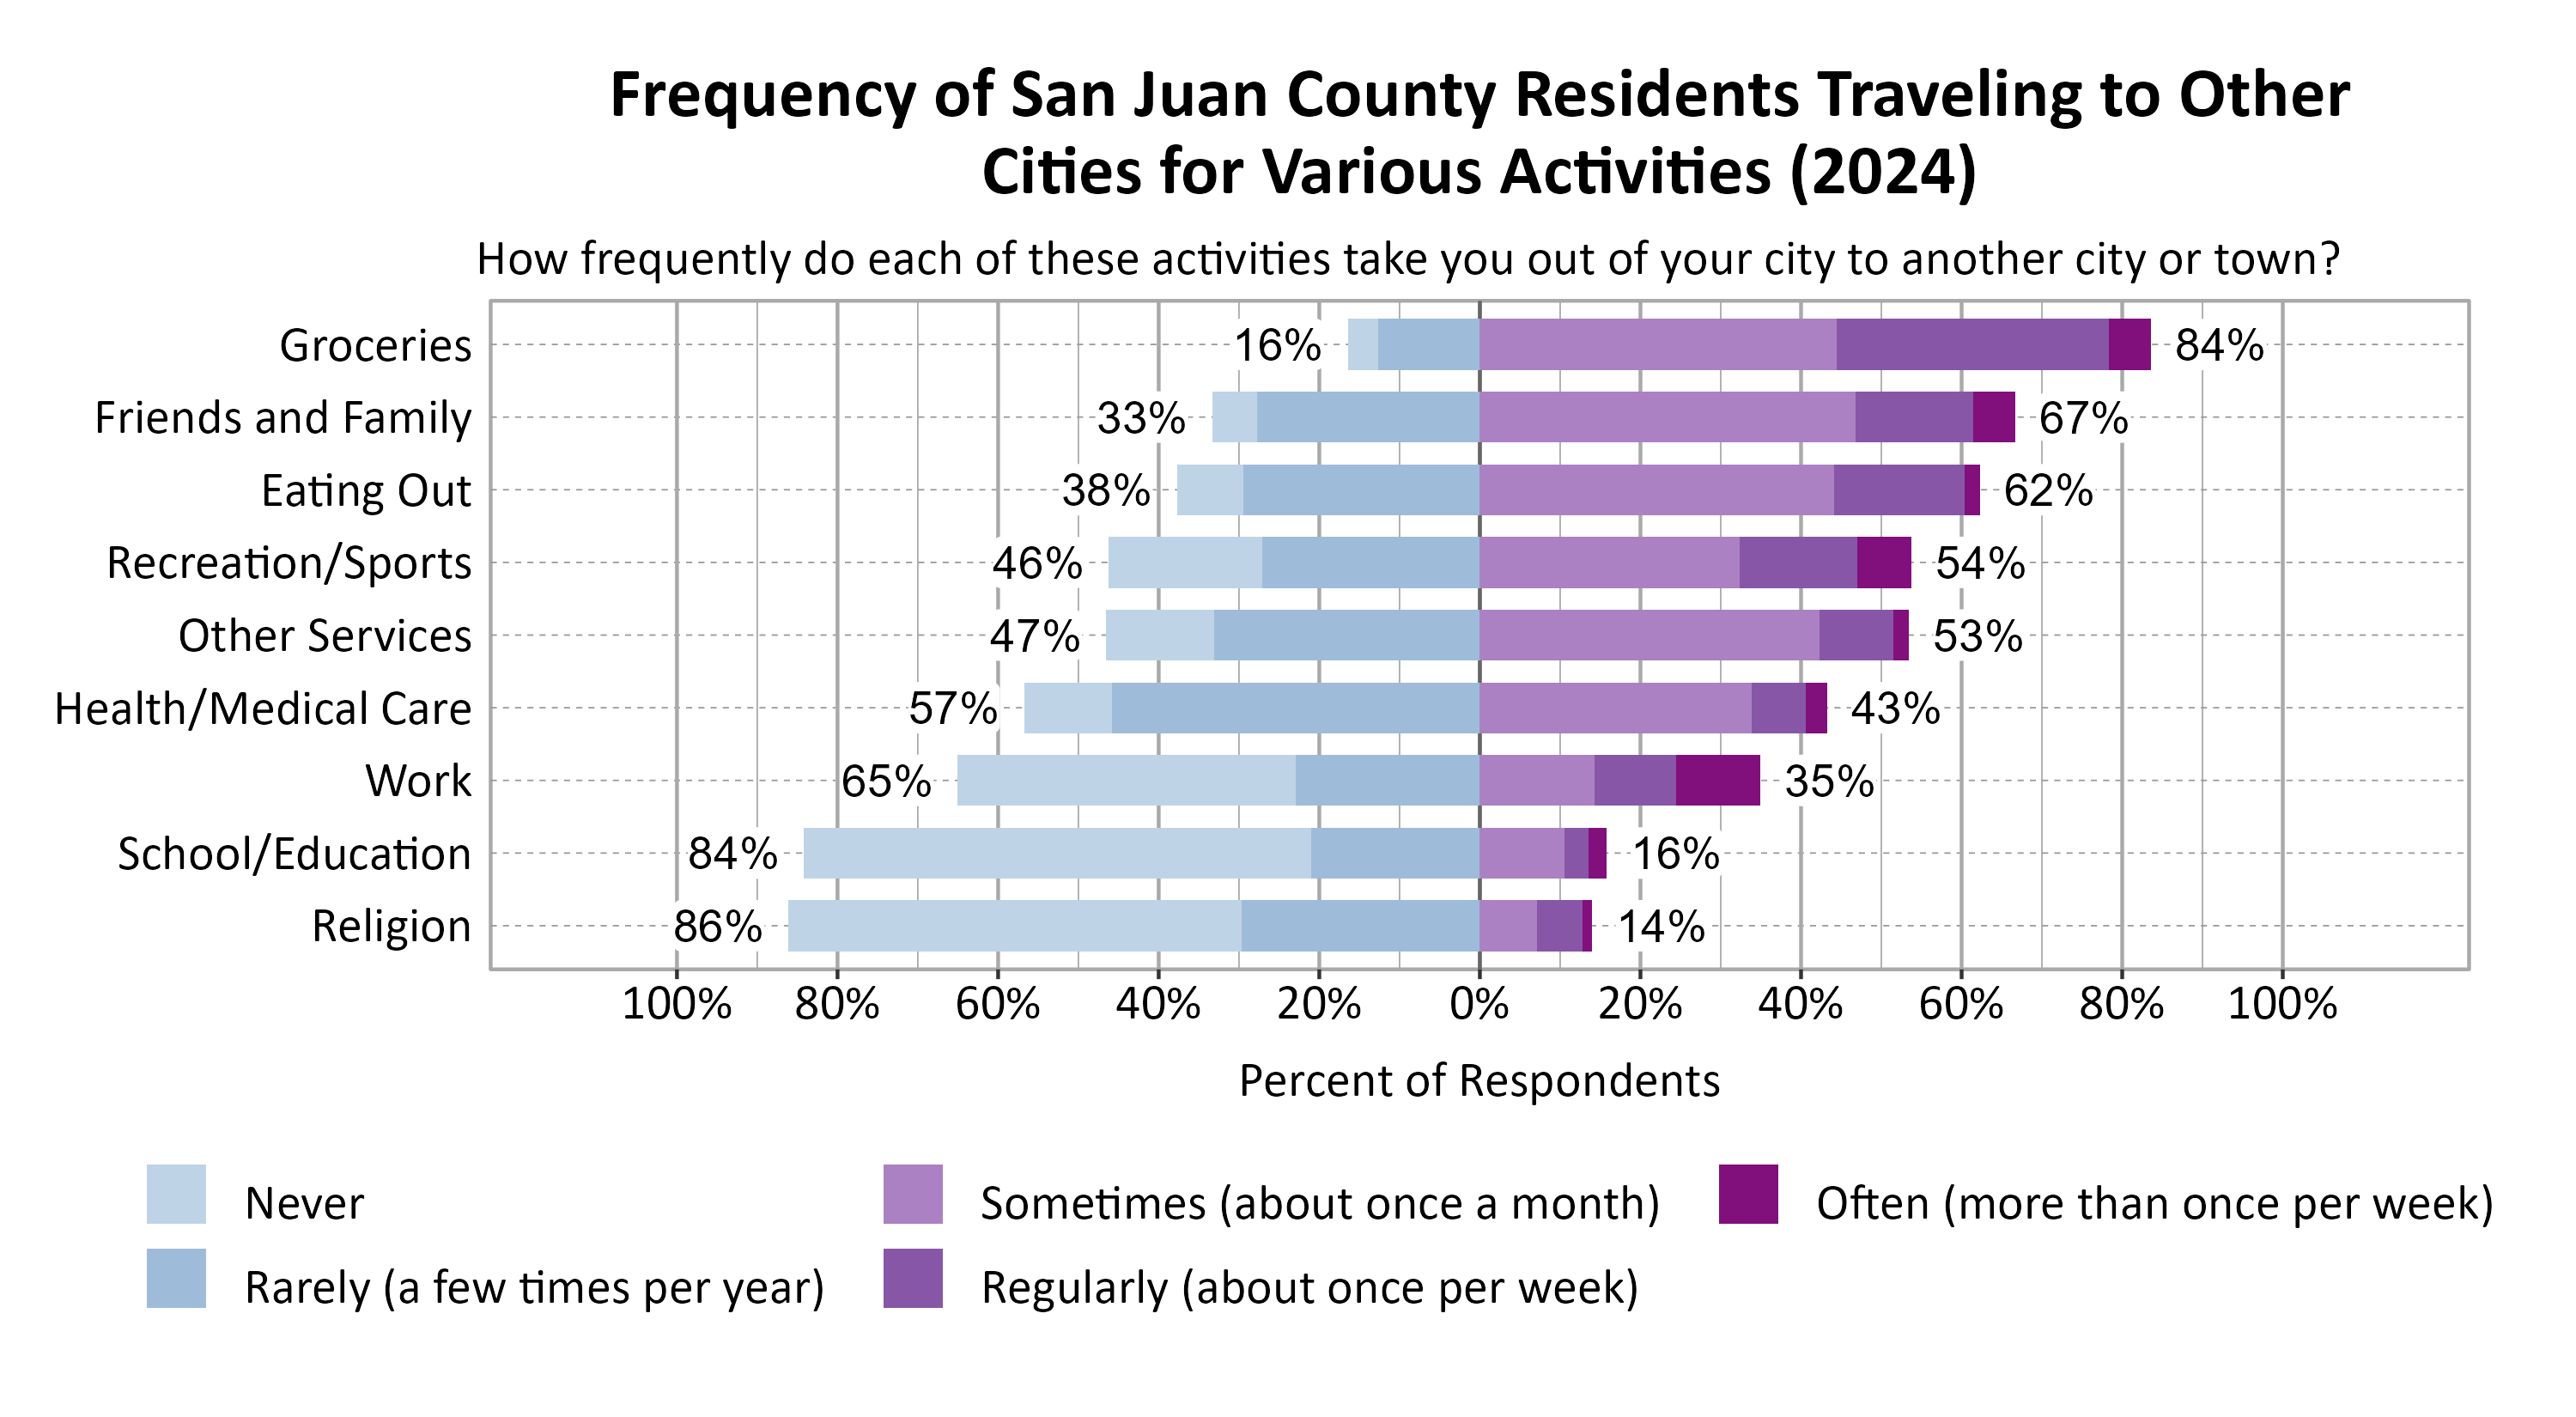
Respondents were asked to indicate how frequently various activities take them out of your city to another city or town. The most commonly indicated reasons for traveling to another city or town at least sometimes or once a month in San Juan County were Groceries (84%), Friends and Family (67%), and Eating Out (62%).
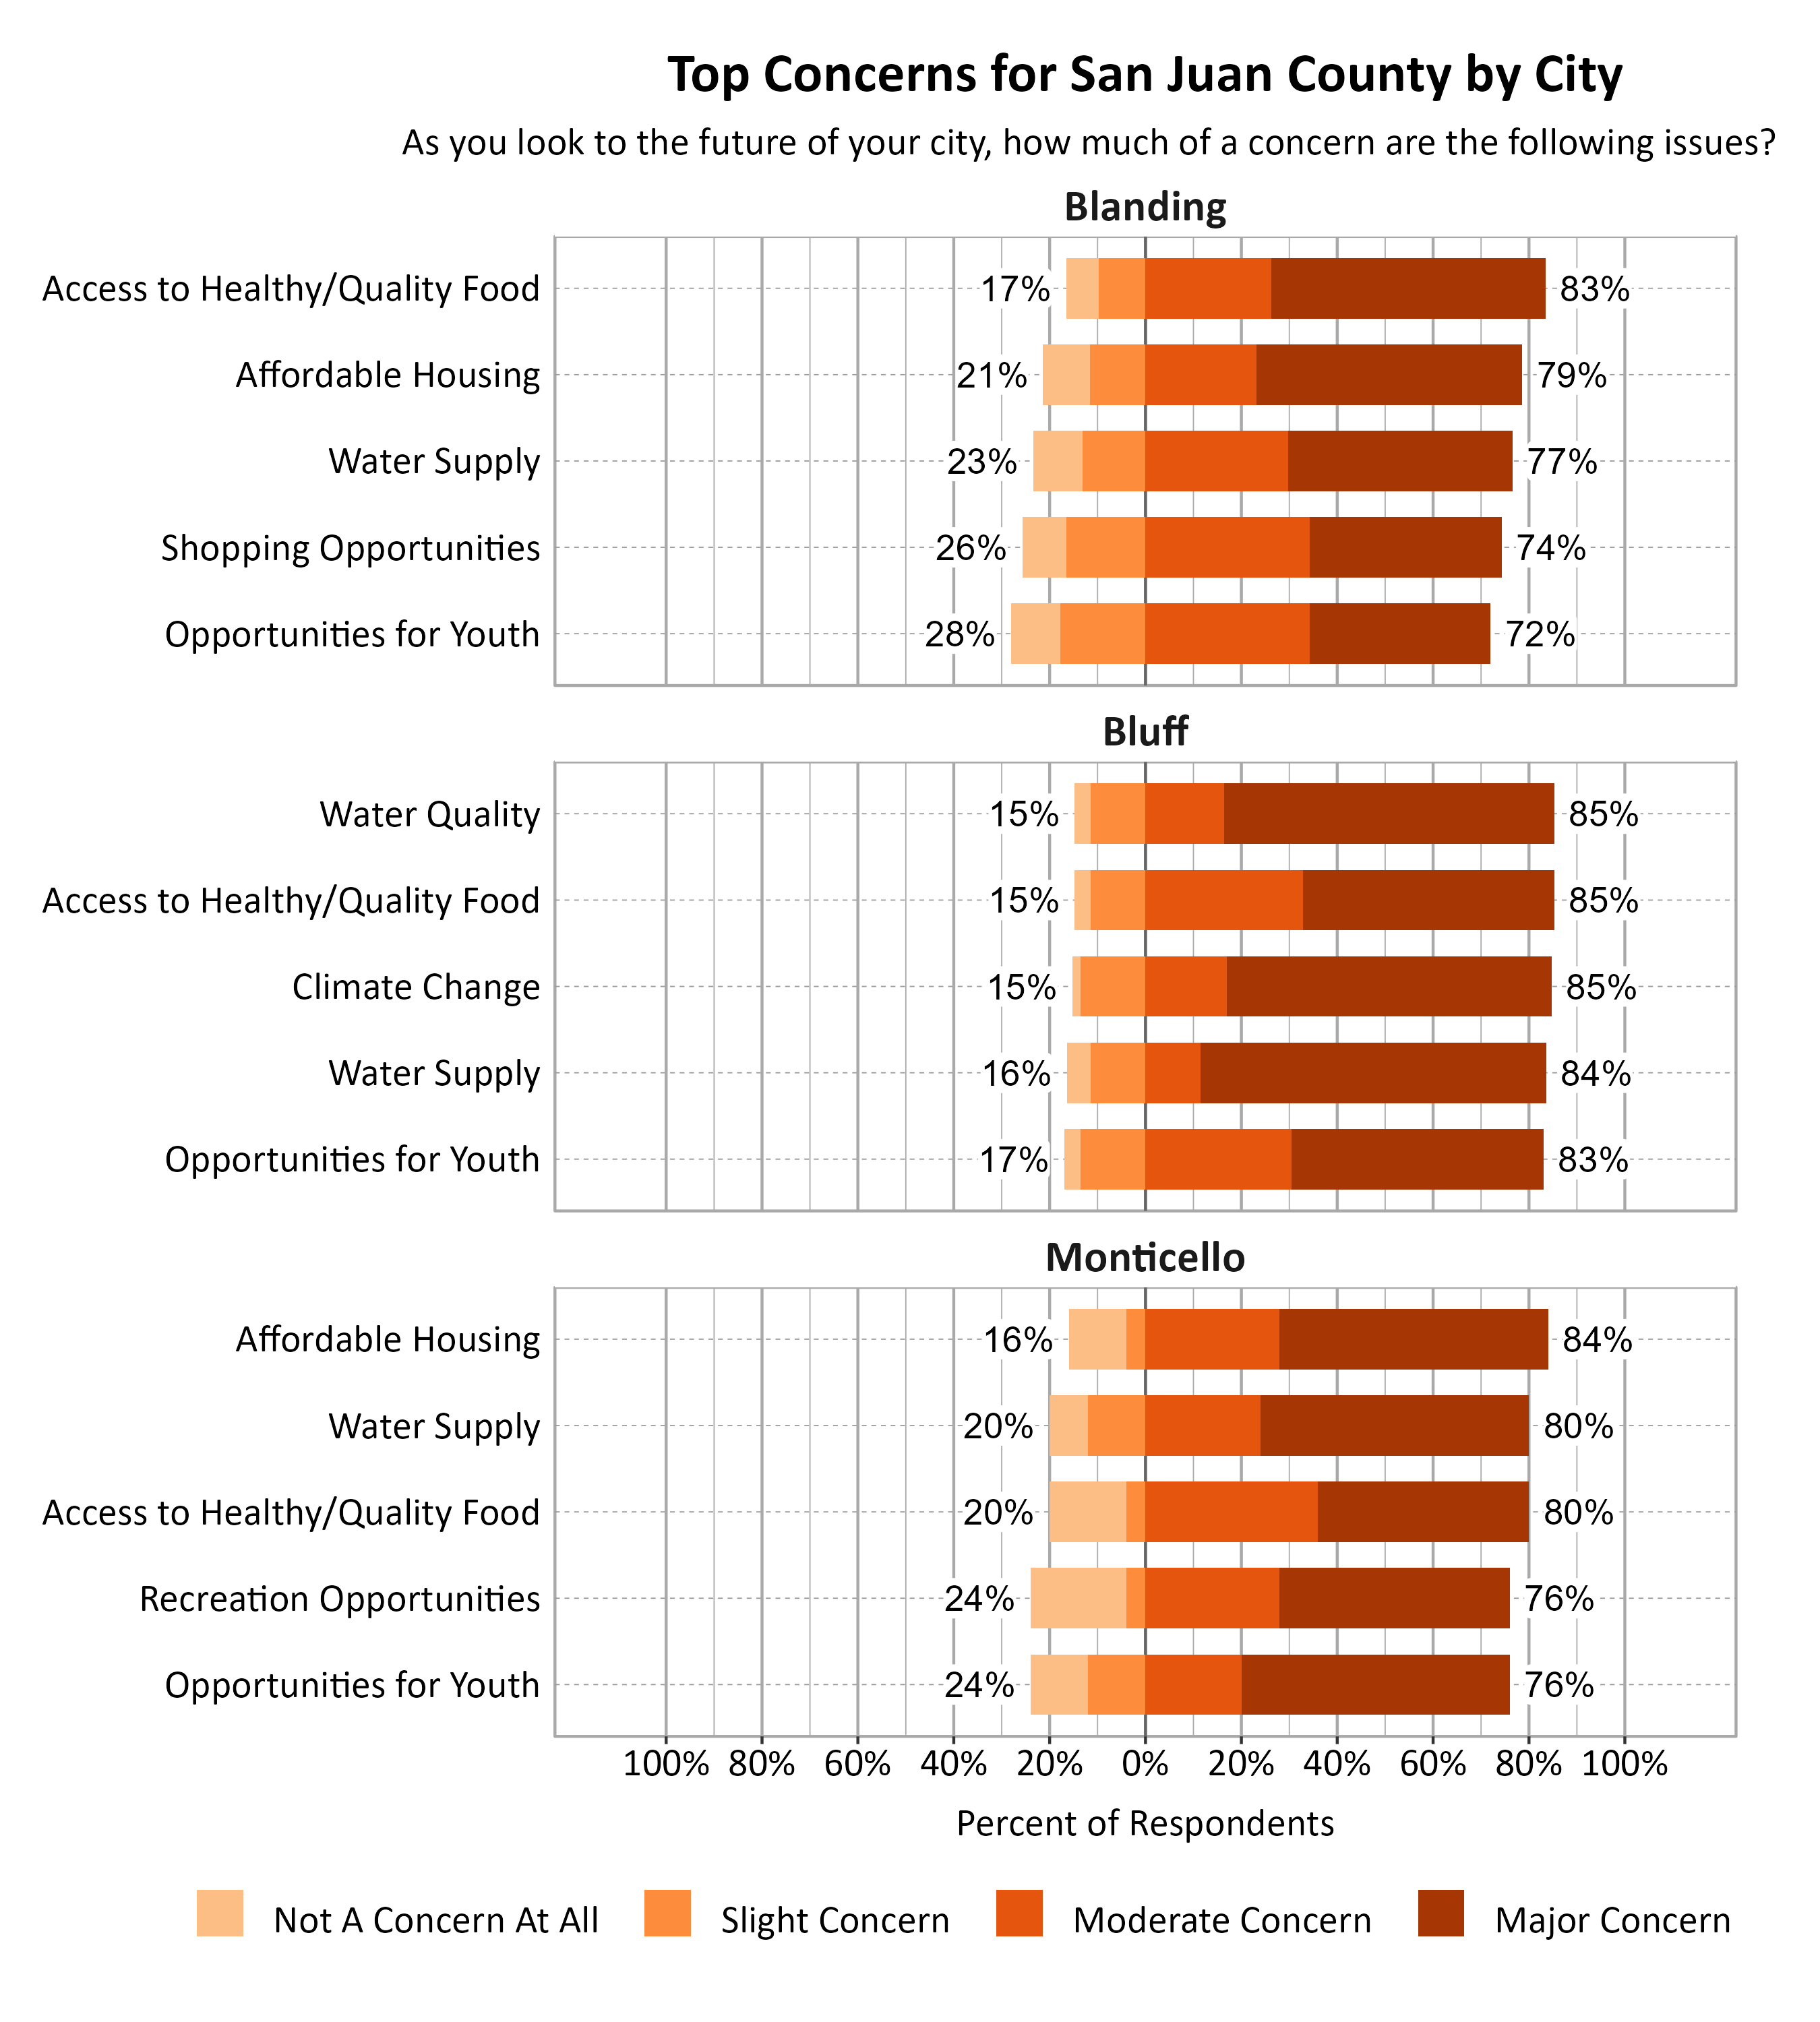
Concerns for the Future of San Juan County Cities
Survey respondents indicated the degree to which a number of possible local issues were a concern as they look to the future of their city. Across San Juan County, Access to Healthy/Quality Food (84%), Water Supply (79%), and Affordable Housing (78%) were the top concerns.
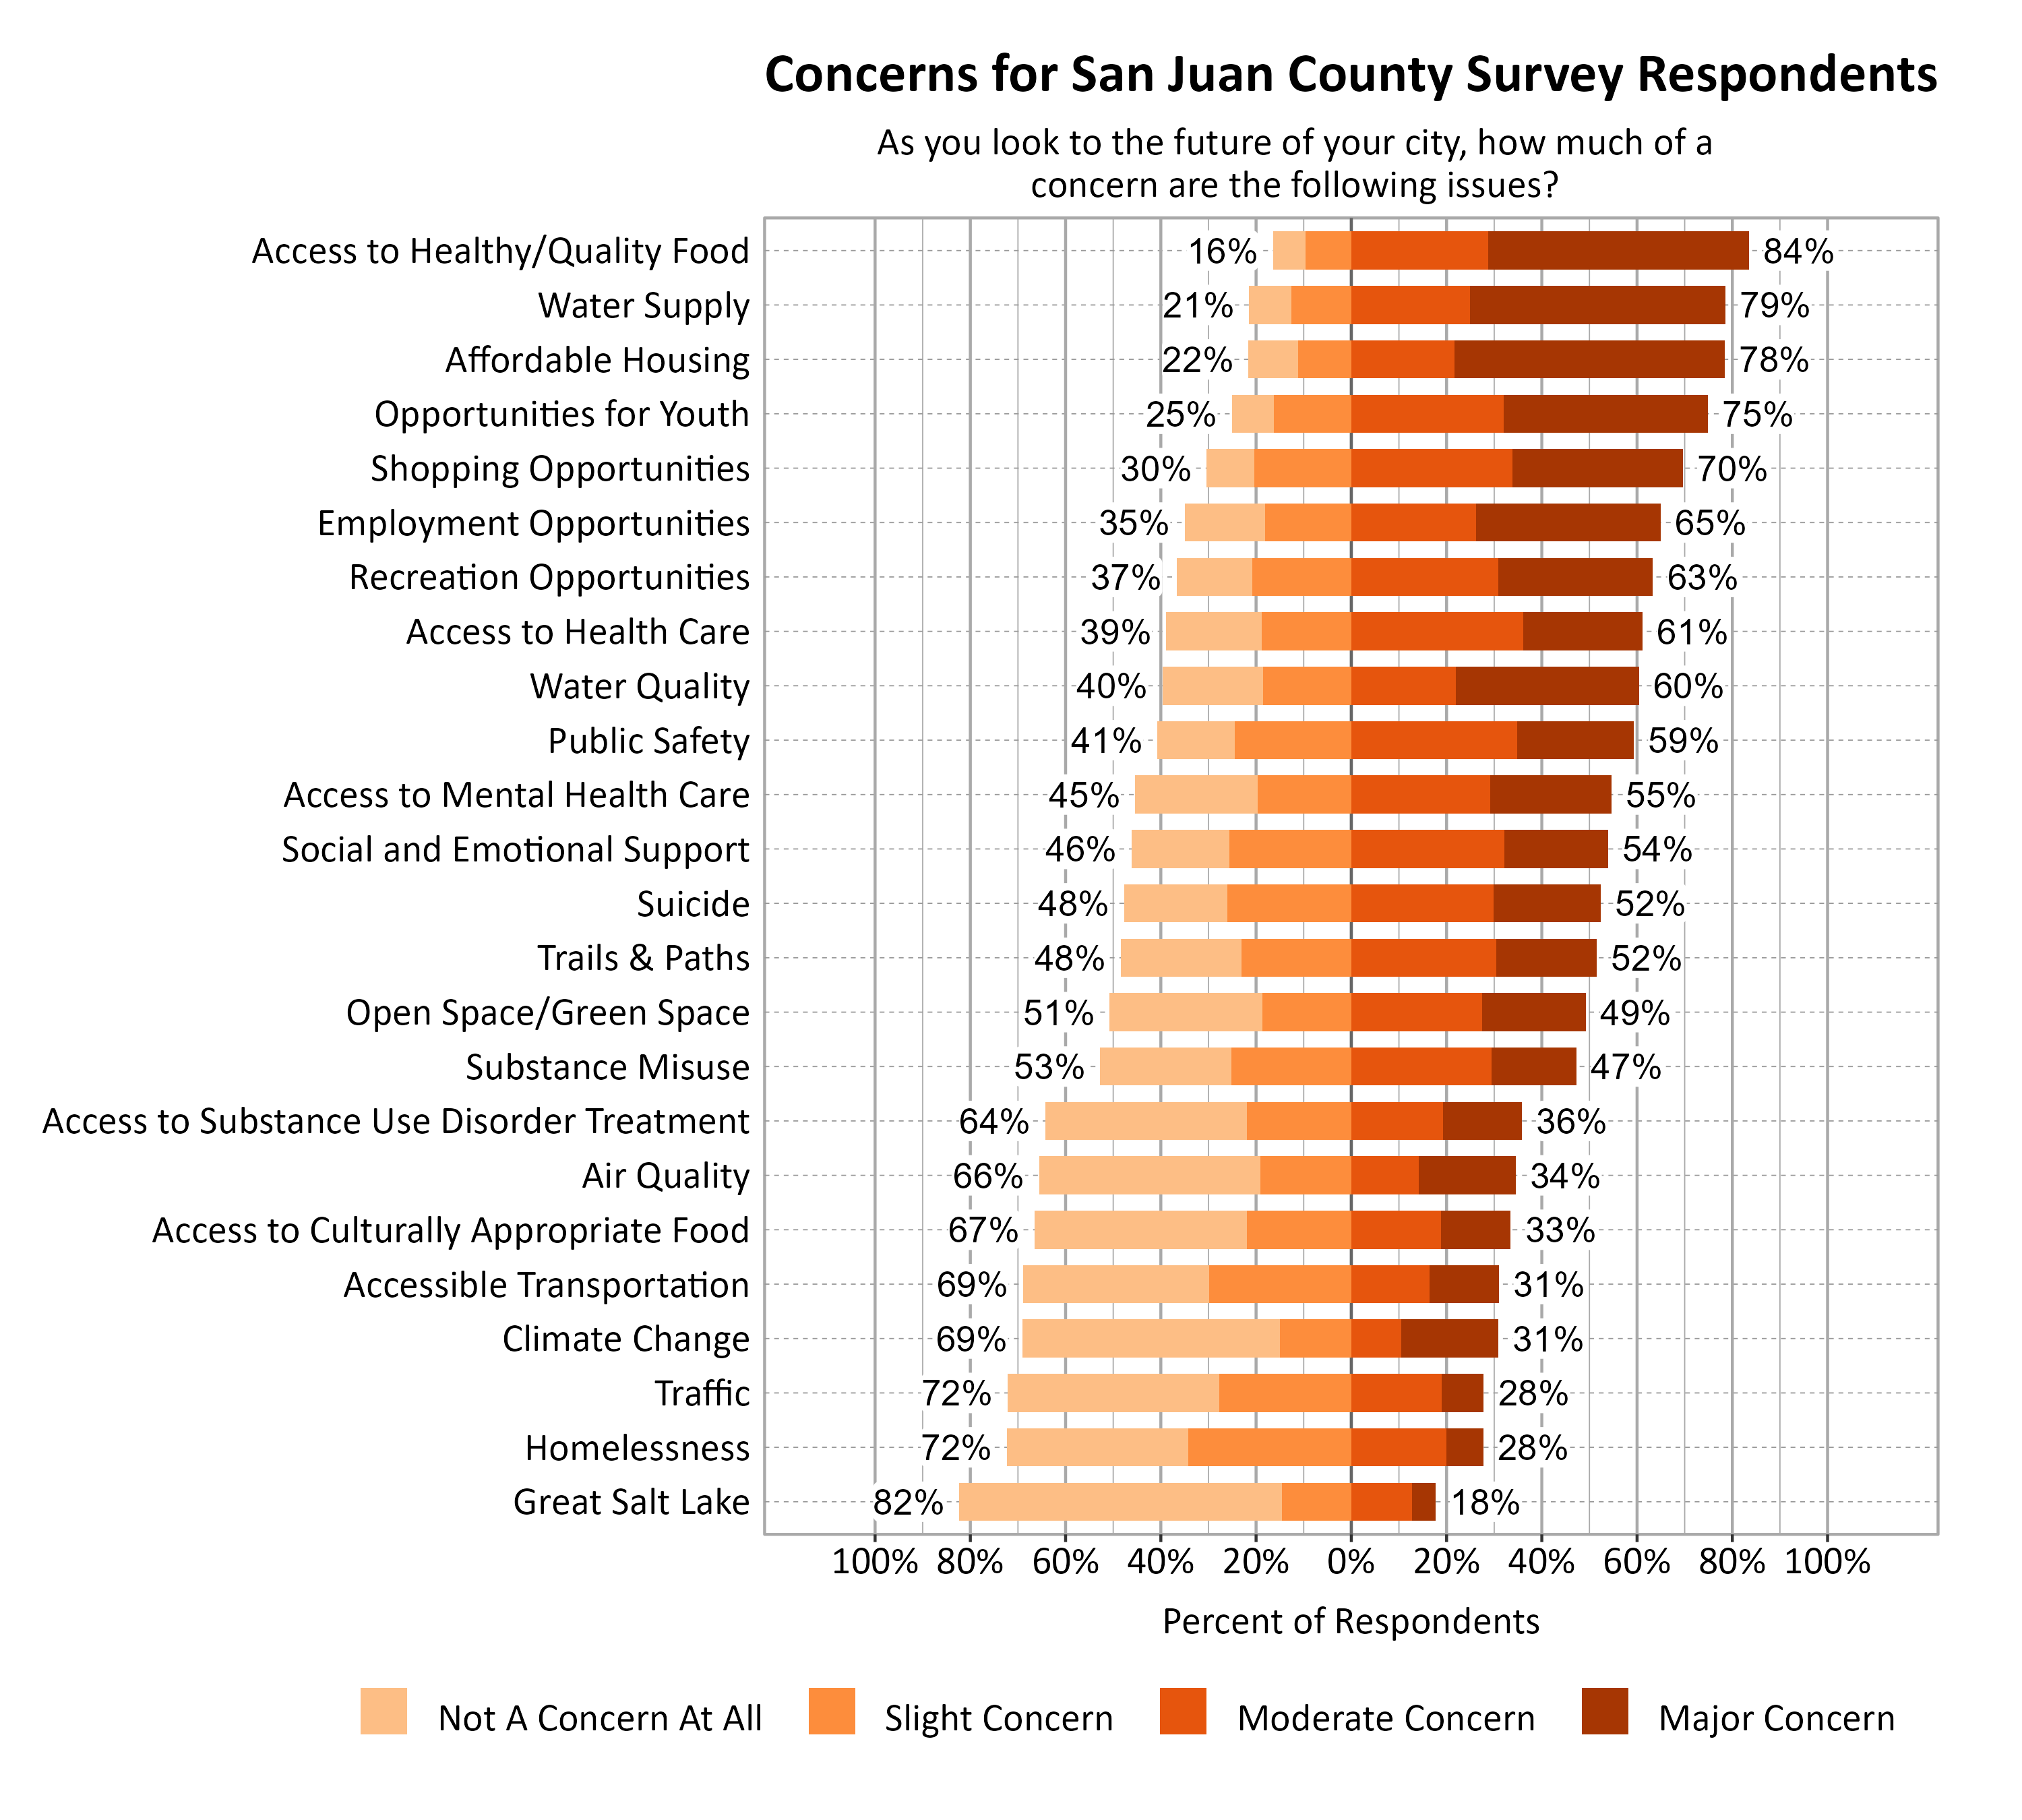
Top concerns also varied across cities. The top five concerns for each city are highlighted in the graph below.