Comparing Secondary Metabolite Content of Fruits and Leaves in a Tropical Forest
Comparing Secondary Metabolite Content of Fruits and Leaves in a Tropical Forest PDF File
Introduction
The goal of this project is to evaluate the similarity of secondary metabolite composition in the leaves vs reproductive tissues of sympatric species in the genus Psychotria, which are typically understorey shrubs in tropical forests. The process for this involved collecting samples of plant tissue from Barro Colorado Island, Panama and analyzing the chemical composition of those samples.
- Secondary Metabolites: Compounds that are not required for the growth or reproduction of an organism but are produced to confer a selective advantage to the organism
- Possible functions of secondary metabolites:
- Inhibition of competing organism’s growth
- Defense against predators and parasites
- We do not know the identity of 99.9% of secondary metabolites, and we want to know why so many are produced.
Methods
After tissue samples had been freeze dried, they were processed to a powder and dissolved in ethanol and formic acid. The secondary metabolites extracted using these solvents were separated from the insoluble plant tissue while in solution, then the solvents were evaporated from the secondary metabolite solution so that the dry mass of the secondary metabolite extract could be calculated using a microbalance.
Results
One way we decided to analyze the secondary metabolite mass data was to compare the ratios amongst tissues. Table 1 shows some statistical analyses of the ratios of secondary metabolite mass between leaves and other tissues amongst all the species analyzed. The only ratio with a significant P value was Leaf: Immature Seed. The 𝑅2 values were fairly weak for all the ratios.
| Tissue | P-value | r-squared |
|---|---|---|
| Immature Pulp | 0.067 | 0.164 |
| Immature Seed | 0.031 | 0.239 |
| Mature Pulp | 0.235 | 0.035 |
| Mature Seed | 0.072 | 0.169 |
We chose to compare the proportions secondary metabolite mass between leaves and other tissues, regardless of species.
Figure 1 shows the distribution of secondary metabolite mass when results are grouped by tissue type. Ripe pulp has the highest median, while unripe pulp and both seed types have very similar distributions. Figure 2 shows the distribution of secondary metabolite mass when results are grouped by species rather than tissue type. Both ANOVA test p-values are below 0.05, which tells us that the groups definitely do not have the same average secondary metabolite mass.
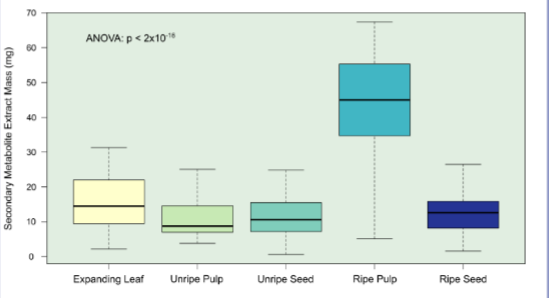
Distribution of secondary metabolite mass grouped by tissue type.
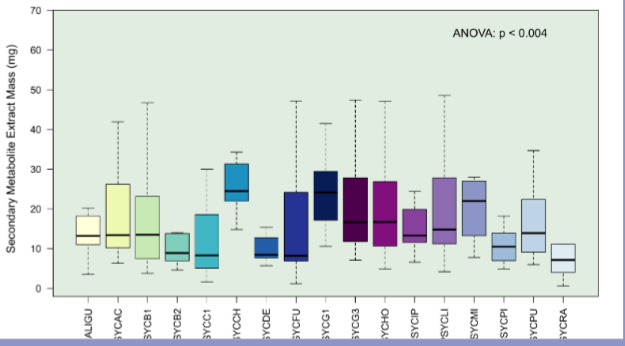
Secondary metabolite mass regardless of tissue, group by species.
Conclusion
It is known that leaves contain high levels of secondary metabolites, but it is interesting how significant of a role the ripening of pulp plays in secondary metabolite mass.