Media Analytics
With the media analytics, you can determine which students have viewed a video, how much of the video they have viewed, and how many times the video has been accessed.
View Media Analytics in My Media
To view a videos analytics from your My Media repository, follow these steps:
Open My Media
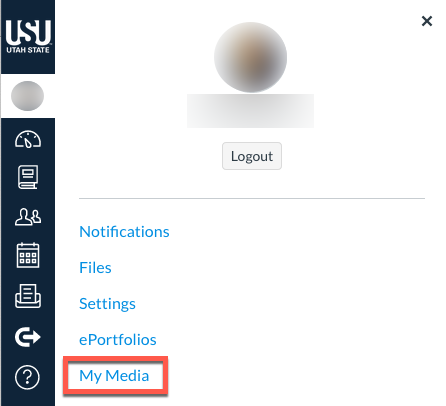
Click on the title of the video for which you want to view the analytics
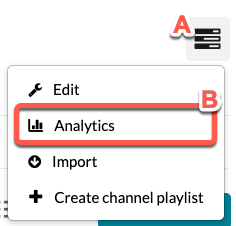
Click on the Actions drop-down menu
Choose Analytics from the menu
The following video describes some of the data provided
Media Gallery Analytics Overview
Adding media to a course Media Gallery makes it possible for you to get aggregate analytical data on the media included in the gallery.
To see playback details for course videos:
Click on the Media Gallery link in your Canvas course
Click on the Channel Actions icon in the top, right-hand corner
Then choose Analytics from the menu
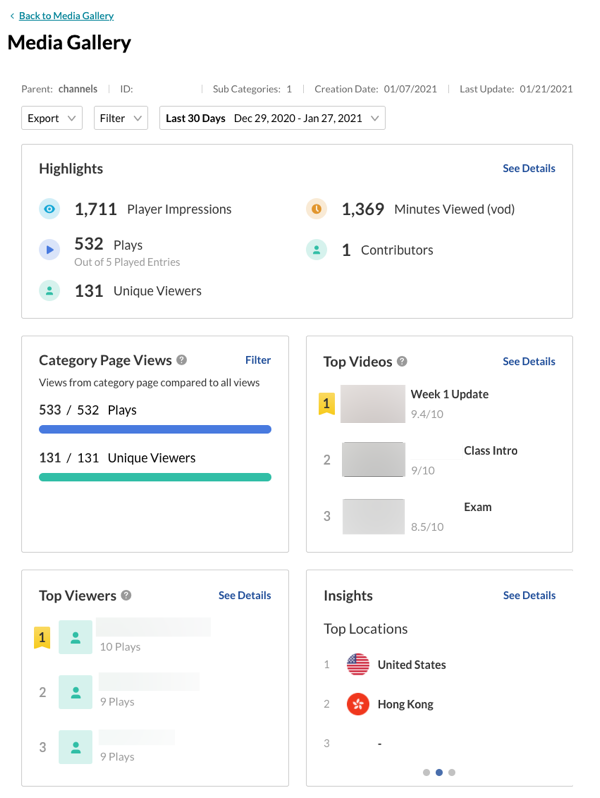
At this point you can view, export, and filter the results
Here is a sample data page
Definitions from Kaltura's Knowledge Center
Example: If a user once watched 20% of the video and the second time watched 80% of the video, the calculation will be: (20+80)/2 plays = 50% Avg. Completion Rate.
- 25 percent play-through – The number of plays that reached 25% of the video
- 50 percent play-through – The number of plays that reached 50% of the video
- 75 percent play-through – The number of plays that reached 75% of the video
- 100 percent play-through – The number of plays that reached 100% of the video
- (Not included in the bar chart below) Play-through Ratio – The percentage of completed plays.
- The number of 100% play-throughs divided by the total number of plays.
More details about the dashboard can be found on Kaltura's Knowledge Center page, User Analytics Open External Link